

1 Introduction
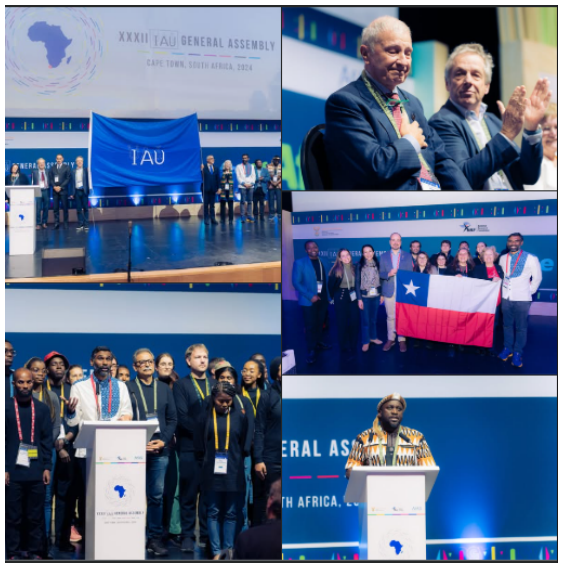
“The XXXII International Astronomical Union (IAU) General Assembly, held for the first time on the African continent from 6 to 15 August 2024, marked a historic milestone in the global astronomy community. Driven by a bold vision, the event highlighted Africa’s growing scientific capacity, and embodied the African spirit of Ubuntu, emphasising on accessibility, impact, and sustainability” [Govender et al., 2025, p. 1]. The conference hosted a total of 2,648 participants, including 2,045 in-person attendees and 603 virtual participants, representing 107 countries, with 28 from Africa. Among the attendees, 647 were students (500 in-person and 147 virtual). During the event, a total of 211 oral presentations and 16 poster sessions took place.
Along with the scientific programme, numerous social and side events were organised. These public outreach activities took the form of lectures by prominent scientists, interactive discussions in local venues, and cultural evenings. Many of these events were also open to the public, collectively attracting over 3,500 participants, including students, educators, and conference delegates [Kubheka & Macfarlane, 2024]. The General Assembly (GA) also included online events such as virtual tours, virtual networking sessions, and digital fireside chats for online participants [Moss et al., 2025].
To support the wide range of events, the communication strategy combined media coverage, a social media campaign, a dedicated website, and a daily newspaper. The General Assembly website saw significant traffic, attracting tens of thousands of visitors, with a large proportion of users from countries including South Africa, the United States, and the United Kingdom. The event’s daily newspaper, Umnyele Wezulu, published eight editions, providing regular updates and receiving thousands of views. In total, the conference received 118 mentions across print, broadcast, and online platforms, reaching a total circulation of nearly 88 million people, expressed as potential audience size across all media outlets that covered the events.
This event also had a dedicated social media campaign carried out across Bluesky, Facebook, Flickr, Instagram, LinkedIn, TikTok, X/Twitter, and YouTube, running from January to August 2024. All the scientific sessions and most of the outreach events, were live streamed on YouTube, offering free access viewing to the public and participants.
As the literature highlights, integrating social media activities into scientific events can support real-time public engagement in science discussions, promote scientific research [Mueller-Herbst et al., 2020], and build trust and awareness around STEM topics [Gilavand et al., 2023]. As the digital hub for the world’s largest astronomical conference [Cunnama, 2023], we were well-positioned to explore these possibilities. Research suggests that social media can extend the reach of outreach initiatives, engage broader audiences, and enhance public understanding of science [Weingart et al., 2021]. While scientific social media activity often focuses on professionals and experts [Albrecht et al., 2022], our campaign aimed at reaching that part of the public not usually involved in astronomical discussions, particularly African audiences, by showcasing astronomy topics and outreach initiatives.
Literature highlights key elements for successful engagement in scientific social media campaigns including emotional resonance, compelling visuals, and strategic planning [Wang et al., 2019; Halpern & O’Rourke, 2020; Newman & Beets, 2023]. In addition, Keegan and Rowley [2017] developed a standardised evaluation framework to enhance the effectiveness and professionalism of science communication on social media, building on the Social Media Metrics (SMM) Evaluation Framework. They outline a comprehensive six-step evaluation framework that defines clear objectives and determines relevant performance metrics and indicators. Beyond data collection, the process includes creating a detailed report, suggesting that this process would promote key reference points, supporting the exchange of best practices among science communicators, encouraging learning from previous initiatives, and improving efforts by leveraging and expanding upon established work.
Literature has mainly focused on the use of social media by participants and speakers on X/Twitter during conferences [Shetty et al., 2022; Power, 2022; Duncan & Shean, 2023; Cusick et al., 2024]. While these insights are interesting, the role of social media dissemination carried out by the organisational committee remains understudied, and key insights on the performance, role, and use of social media during a conference are still missing.
Building on this body of literature and the foundational review of the conference efforts by Govender et al. [2025], this paper shares insights into the achievements, challenges, and recommendations emerging from this astronomical communication campaign, with a particular focus on the open access format made available at the General Assembly through live-streamed sessions on YouTube.
2 Implementation
The core social media team was composed of two project leads, supported by 6 contributors who assisted with content creation, scheduling, and engagement activities over the eight-month campaign period. Additionally, a designer periodically collaborated with the team to improve the visual elements of the campaign.
For the first four months, we posted content daily, then we transitioned to three posts per week in April and May, before increasing to 4–5 posts per day during July and August 2024. The content shared contained typically similar text and visuals across all platforms. Additional content was uploaded periodically to align with each platform’s nature and expand engagement opportunities.
2.1 Strategy
The social media campaign had three main objectives. Firstly, to highlight Africa as a protagonist in the scientific world. Secondly, to showcase the scientific, social, and innovative impact of the IAU General Assembly. Lastly, to promote astronomy outreach initiatives organised during the conference to engage the local and general public. The campaign was structured into three distinct phases:
- January–March 2024: we focused on re-announcing the conference to improve the number of abstract submissions and boost participation.
- March–Mid-June 2024: we aimed at encouraging registrations and directing traffic to the conference website.
- Mid-June–August 2024: we highlighted the scientific and outreach programs, while acknowledging sponsors for their contributions, and showcasing key conference highlights to increase visibility.
We relied heavily on visual content, including videos featuring scientists and partners, user-generated content, professional images, and graphics created by our designer. Posts were planned 2–4 weeks in advance, when possible, to ensure a cohesive narrative aligned with each major objective and designed to evoke positive emotional responses, like achievement, amazement, pride, togetherness, and humour. While the overall tone of the campaign’s posts reflected the conference’s institutional nature, we also integrated humorous content to broaden audience engagement. The posts were usually scheduled around the middle of the day in UTC+2 and the time was picked trying to maximise the average number of active users, based on platforms’ suggestion.
The African context was central to our communication approach. While we featured numerous purely scientific content, part of the output was also pointed at showcasing tourism destinations, celebrating South African festivities (e.g., Mandela Day) and promoting African partners (e.g., SAAO, Brand South Africa, AFAS). This special focus was aligned with the conference’s broader effort of “organizing the event with an African spirit”, organising activities such as local school outreach, an African craft market called ‘Jabula’ (meaning ‘happy’), and a live radio broadcast [Govender et al., 2025, p. 3; Kubheka & Macfarlane, 2024].
We used the above-mentioned platforms to reach specific and distinct groups of audiences. Facebook has a large user base worldwide and maintains a lead in African and Asian markets [Bhanye et al., 2023]. This allowed us to reach the highest number of people, especially in Africa. X/Twitter has been historically linked to conference outreach, so we adopted it, but we also wanted to reach academics and professionals who had left the platform for alternatives [Quelle et al., 2025]; at the time the most prominent was Bluesky, permitting us to address trending narratives promptly. Astronomy is a naturally visual science, so we utilised Instagram and Flickr, whose visual storytelling formats aligned well with the content of an astronomical conference (i.e., astronomy pictures, conference moments, and outreach events). Lastly, we used LinkedIn and TikTok (while the latter rather unsuccessfully) to reach professionals and younger populations, respectively.
Most of the content was only available in English, except for the YouTube recording of the conference’s session, where the integrated subtitles translation function allowed us to have reasonably correct subtitles in over 100 languages supported by the platform. Moderation was carried out through two short daily routines, at the opening and closing of each day, by a single team member who reviewed each platform to moderate the comments and answer questions received through direct messages. Lastly, social media was never used to share sensitive information with participants for crisis communication. In particular, the central organising committee, for sensitive and time-critical matters, made use of more direct ways of communication, including e-mails and live announcements.
2.2 Open access format
In line with the convention’s effort to improve accessibility with initiatives like hybrid poster session, VR-online space discussion, free childcare, the conference also featured open access live stream of all sessions that were freely available worldwide through YouTube [Govender et al., 2025; Moss et al., 2025]. This initiative was designed to broaden accessibility beyond professional astronomers to include students, educators, amateur astronomers, and professionals for whom registration fees might have been a barrier. Unlike the paid online attendee experience, the open access format offered passive viewing only, without interactive features such as live questions. Only registered, paying participants could present or contribute to sessions. Open access viewers were restricted to YouTube streams, with no access to the official conference platforms; sessions were streamed from the paid-access Zoom account to pre-scheduled YouTube streams, with each session linked to specific conference venues (e.g., Auditorium 1, Auditorium 2) [IAU General Assembly, 2024].
2.3 Metrics
Later in the paper, we provide data retrieved from platform analytics and third-party websites of our social media results. Among them, reach and engagement were defined according to Trunfio and Rossi [2021]. In more detail, reach is characterised as the total number of views per post, measured independently for each platform. The engagement rate, instead, was calculated by comparing total interactions to reach per post across TikTok, X/Twitter, and Bluesky. For LinkedIn, engagement was determined based on a combination of interactions, clicks, followers, and impressions, while on Meta Apps, Facebook and Instagram, engagement was assessed as total interactions per post. Lastly, regarding YouTube, we used the available data on views, unique viewers, total watch time, and new followers [Google Support, 2025].
3 Key insights and recommendations
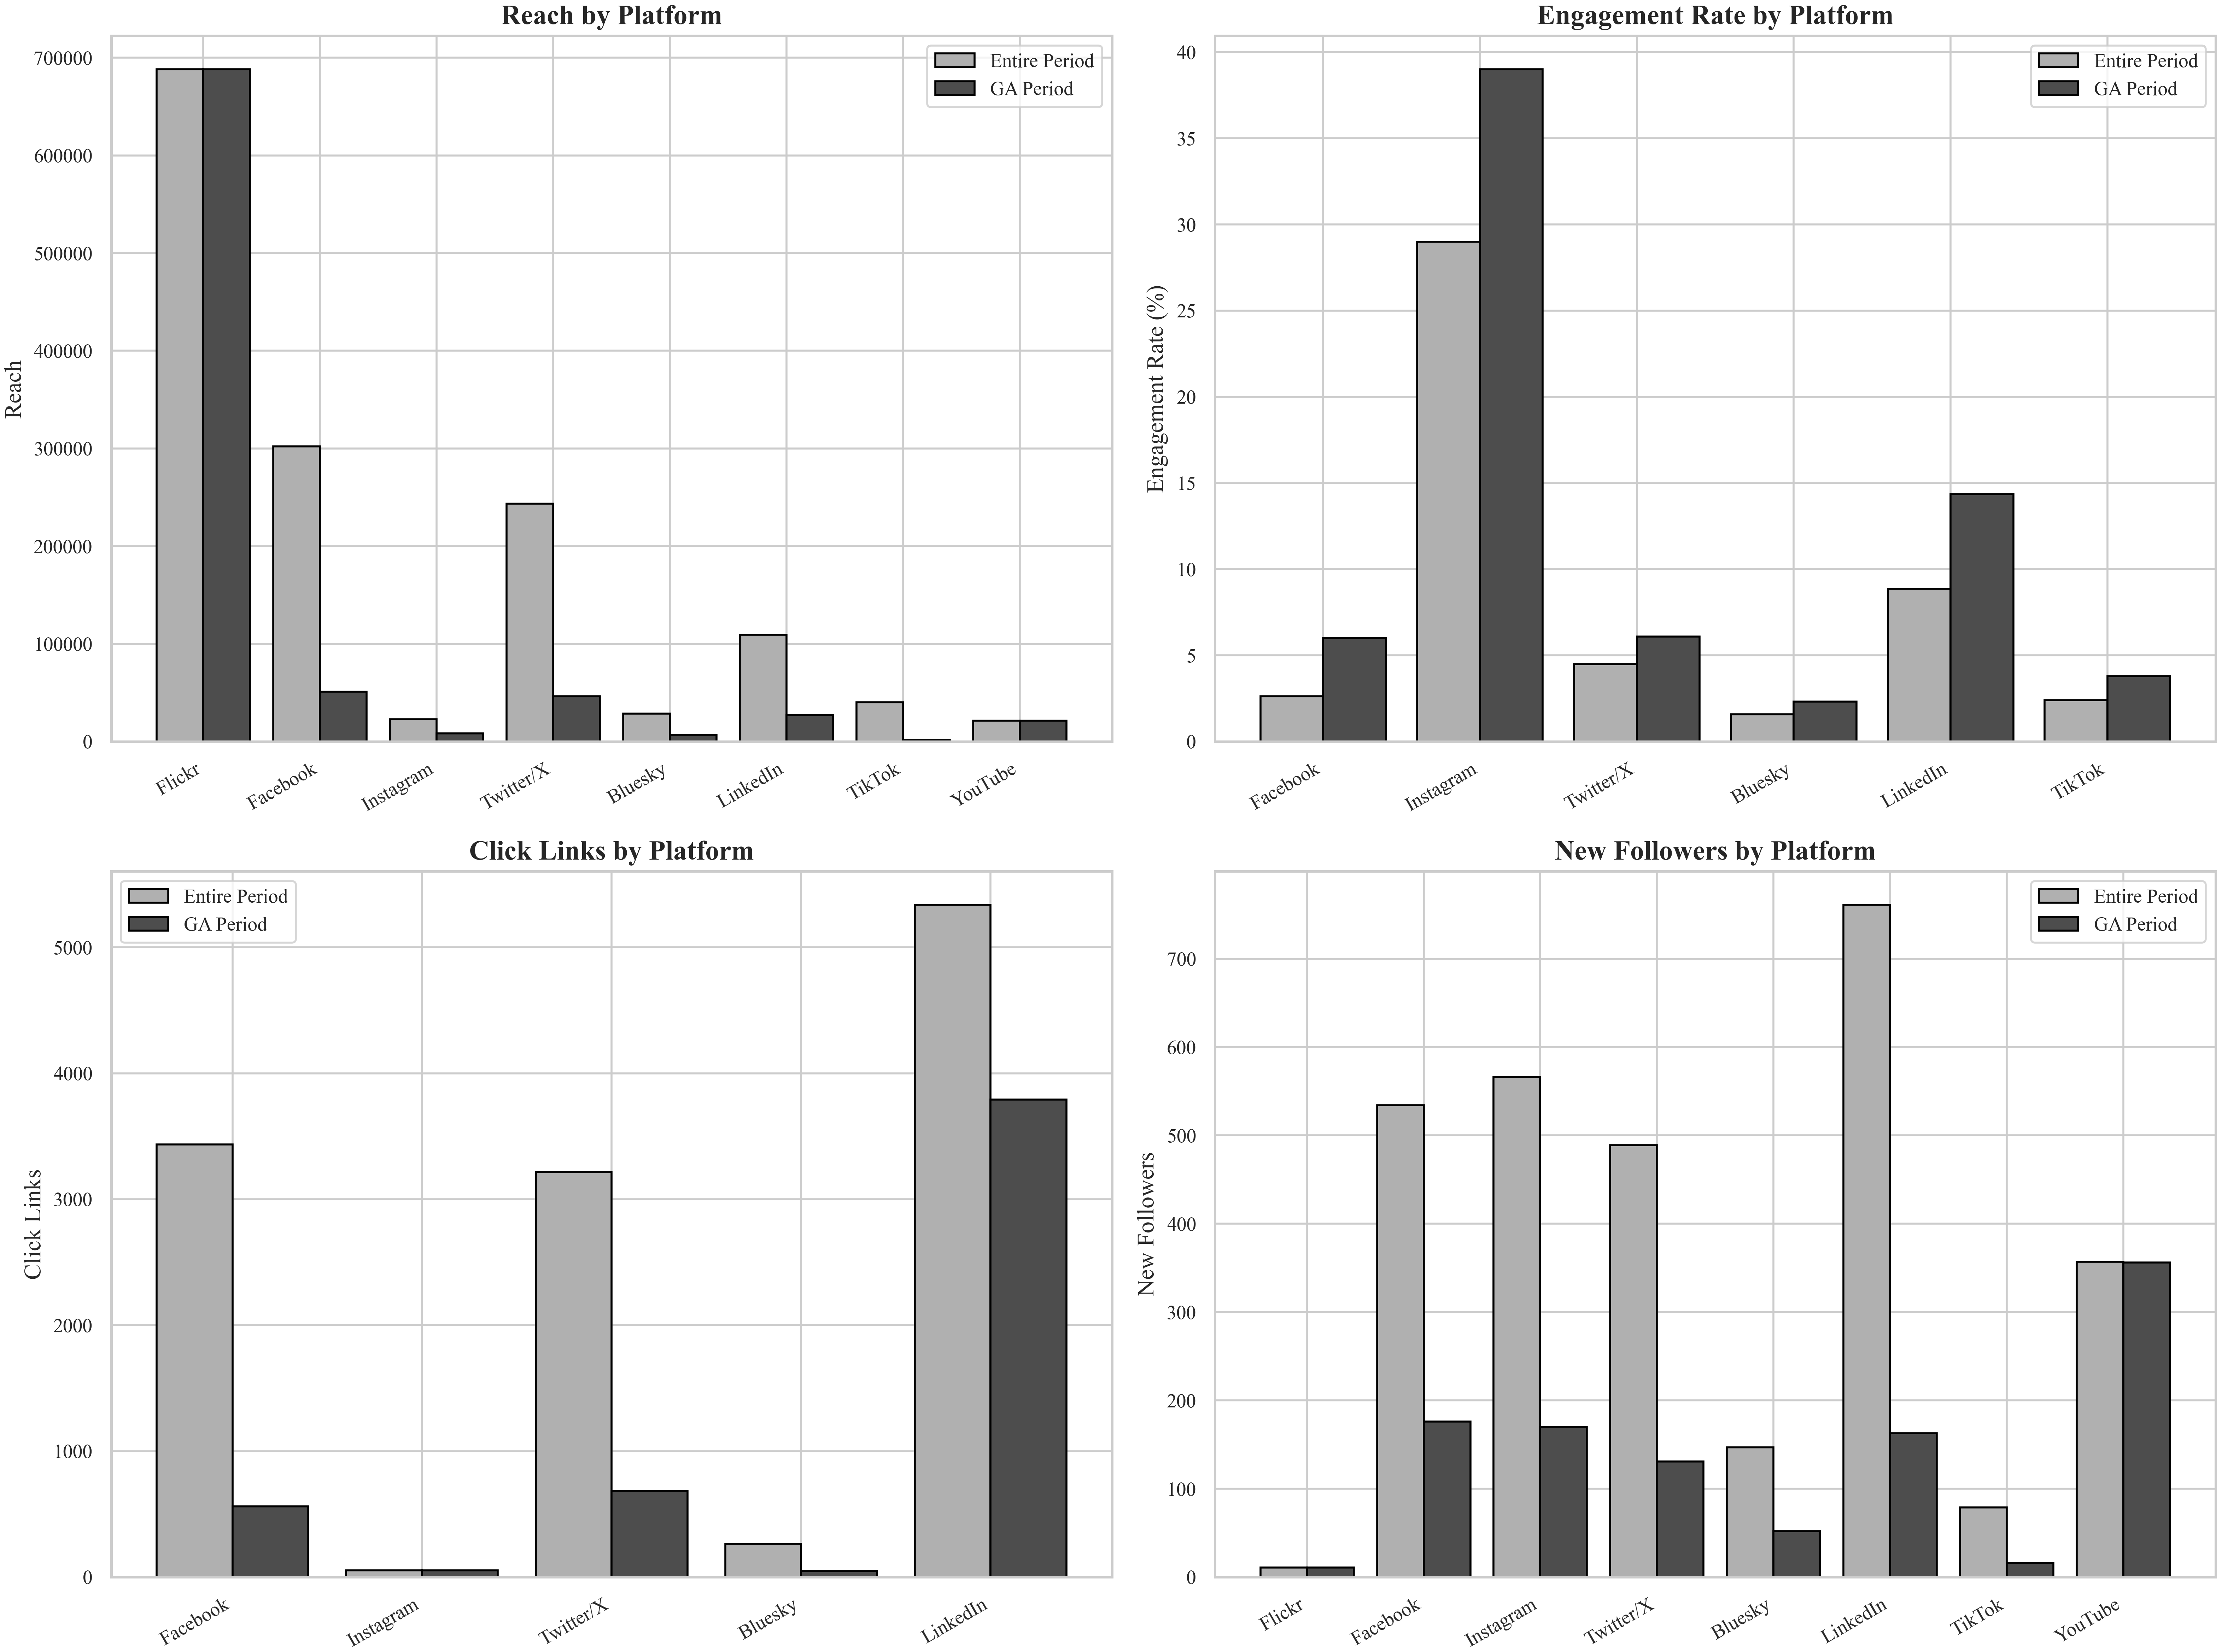
Overall, between January and August, the social media campaign gathered approximately 1.46 million in cumulative per-post reach across all platforms. In particular, Flickr had the highest per-post reach, with significant contributions from Facebook and X/Twitter, with 58% of this cumulative per-post reach registered during the General Assembly period (August 5–18, 2024). Engagement rates rose during the GA period as well, reaching 39% on Instagram. While for the overall campaign the engagement rate was on average 8.15%, varying across platforms, with Instagram demonstrating the highest engagement rate at 29%, followed by LinkedIn at 8.85% (Figure 1).
Facebook and Instagram were the most effective platforms for engagement and follower growth, while Bluesky and TikTok showed lower interaction levels. In particular, while there was significant engagement from users in Asia, the United States, and Europe, approximately 40% of the audience was based in South Africa, primarily in the Cape Town area. From the available data on platforms tracking audience demographics, we observed an overall distribution of 51.1% men and 48.9% women. These numbers are averaged and vary between platforms. For example, on Facebook, men constituted a larger proportion within the 25–44 age range, outnumbering women by 6%, although this trend reversed in other age groups. Conversely, Instagram showed the greatest discrepancy, favouring women across all reported age ranges. LinkedIn provided data for followers’ professional occupation showed a near parity between early-career and senior-level followers. As expected, given the conference and platform’s nature, most followers were from what LinkedIn labelled as “academic”, “research”, and “education” backgrounds.
Additionally, an advertising campaign was implemented in February, with an investment of ZAR 10,000 (∼EUR 500) on Facebook and LinkedIn, contributing to approximately 20% of the campaign’s total reach. The activity was carried out with LinkedIn Ads Campaign and Meta Ads Manager/Business Suite. We focused on pointing our target audience towards the GA website. A second advertising campaign, for Facebook and Instagram, was planned during the General Assembly period; however, technical issues with Meta Business Suite and our payment methods prevented its execution.
Summarising, the differences between platforms reflected the distinct audiences they attracted. Instagram’s visual and informal nature aligned well with astronomical and outreach content, explaining the high engagement observed, while LinkedIn primarily drew professionals from academic and educational backgrounds. As shown in Figure 1, Flickr provided high reach but limited interaction, serving mainly as a repository and archival tool, much as YouTube did for the scientific live content. TikTok was the least successful of our efforts, suggesting it may not be a priority for similar scientific events without dedicated and tailored investment.
3.1 YouTube open access
The introduction of open access YouTube streams for the first time in the history of the conference represented a significant advancement in the public engagement and science communication effort of the IAU. These streams obtained 17.9k views, reaching 7.2k unique viewers and accumulating a total watch time of 2.7k hours. From the channel’s launch in February until March 2025, it accumulated 26.8k views, 433 new subscribers, and 3.6k hours of watch time. This initiative extended the reach of the conference far beyond its in-person and virtual attendees. While the primary audience of these streams was not the registered conference participants, survey responses indicated that many paid attendees found this initiative highly valuable. They emphasised the advantages of remote and effortless participation in sessions during the conference, as well as the long-term benefit of maintaining an open access repository of recorded sessions for later review [IAU General Assembly, 2024].
In the final survey conducted among participants of the GA, attendees were asked to evaluate the usefulness of online platforms in supporting their participation. Specifically, regarding YouTube (n = 548), 49% of respondents rated it as “very useful”, while an overall 85% found it useful in some capacity. Respondents who elaborated on their ratings noted that YouTube provided a reliable and accessible medium to follow the conference sessions in case of overlaps and other issues.
“YouTube live broadcast and recording are very helpful for my friends who can’t pay the registration fee”
“The hybrid format was generally working very well, and the YouTube stream open for everyone sets an example for every important conference to follow in the future.”
“Overall as an online participant, it was fine. I certainly appreciate that it could be attended remotely, and some initiatives from it are fantastic for conferences in general e.g., YouTube stream and quick recording availability…”
3.2 Insights
Focusing more specifically on the content that achieved significant success, posts made during the conference reached the widest audience. Professional graphics created by the designer performed well, particularly when showcasing relevant information for the public, like the outreach and cultural activities they could join (see e.g., 1–3 in Table 1). We saw that pictures showcasing participants and the GA activities at the conference performed incredibly well (see e.g., 2–4 in Table 1). In more detail, images capturing the conference atmosphere and its participants, such as group photos or those promoting a sense of accomplishment (e.g., “Africa, we did it”), obtained higher engagement. Additionally, for event pictures, carousel posts tended to achieve higher levels of engagement than single images.
|
Visual |
Description |
Reach & engagement rate |
|
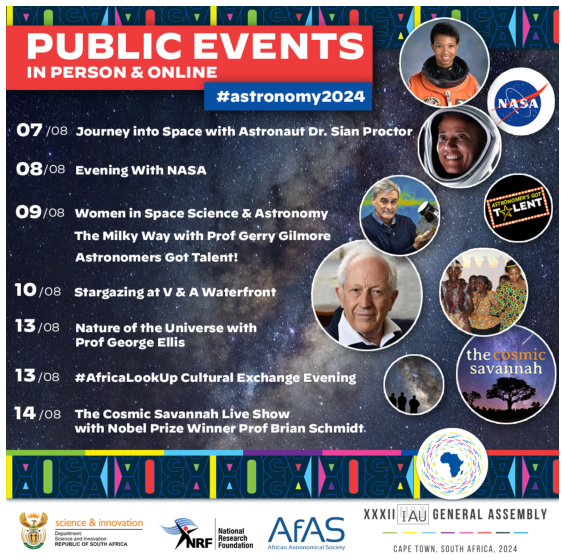
| Don’t miss the exciting public events at the #Astronomy2024! Follow along online and be a part of the astronomical discoveries and discussions. Learn more and join us. |
65,824 — 1,35% |
|
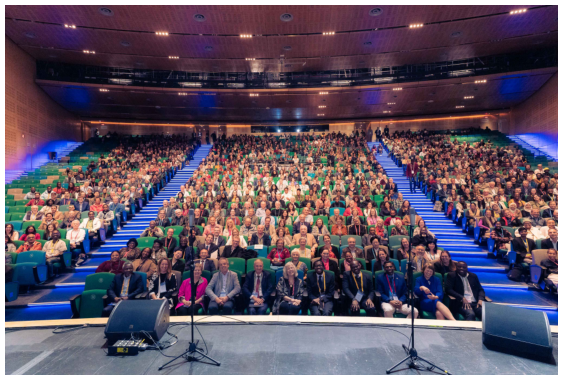
| Check out the brightest stars of the #Astronomy2024! Spoiler: They’re all in this group picture! |
10,204 — 1,55% |
|
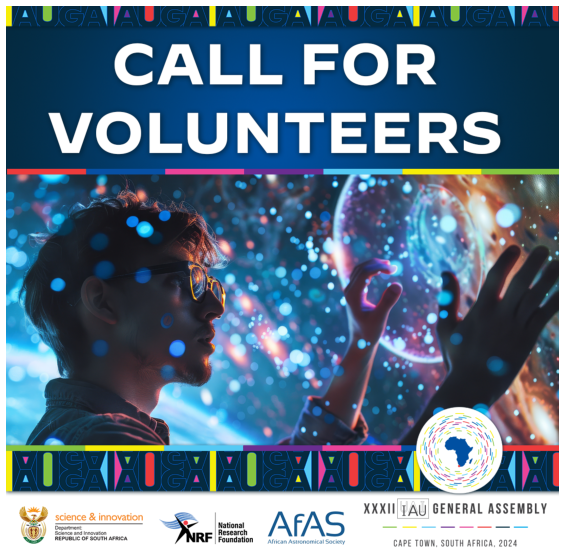
| Passionate about astronomy? Volunteer for the IAU GA 2024 in Cape Town! From 6–15 August, join us in supporting one of the largest global astronomy gatherings. Open to students, amateur astronomers, and science communicators. #Astronomy2024 |
4275 — 1,77% |
|
| Africa, we did it! What an emotional and historic closing ceremony at the IAU GA 2024. A huge thank you to everyone who made it possible! |
3314 — 3,32% |
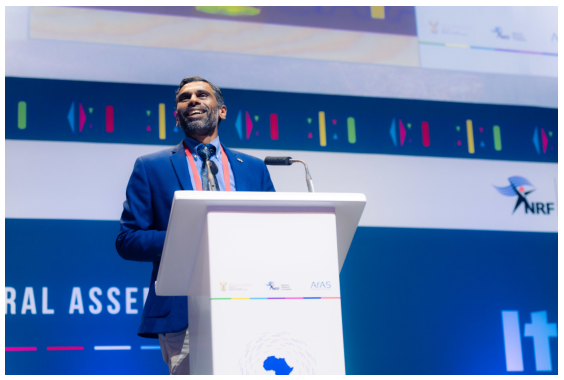
|
| After countless interviews, a mountain of emails, and enough handshakes to power a small country, Kevin Govender, our fearless chair, has made history with the first GA in Africa. |
1245 — 7,8% |
Interestingly, while we featured high-quality videos from partners about South African personalities or conference highlights, these did not perform as well in terms of reach compared to other types of posts (average reach of 843 on Instagram and Facebook against the overall average of 1,764). From examining the captions of the posts in Table 1, it is observable that among the top-performing posts, those with an informal tone performed better than those with a more formal register. On average, symposium highlights did not resonate strongly with our audience, but scientific content focused on outreach received substantial support (see e.g., 1 in Table 1). In addition, we received a lot of public engagement in form of comments or direct messages, primarily regarding activities that the public could be included in, but also about celebrations of the African leadership and the quality of the conference. High level of engagement was directed at pictures of famous people speaking (e.g., the South African minister, GA chairs, Nobel Prize winners, IAU officials, astronauts, ambassadors) as well as celebrations of the conference’s success as the first of its kind on the African continent.
Beyond technical considerations, participants’ engagement emerged as an achievement. Post-performance data and survey responses indicated that 80% of participants found social media helpful for conference information, supporting current knowledge of social media use for conference engagement [Mackenzie et al., 2018; Wong et al., 2021; Shetty et al., 2022]. Considering the points mentioned above, we can infer that we reached a larger audience compared to previous IAU conferences. While the lack of previous data is a challenge, limiting direct comparison with the whole social media campaign, the introduction of the open access YouTube expanded the audience of approximately 5,000 people beyond the 2,000–3,000 participants typical of previous editions, excluding in-person outreach initiatives. The precise composition of this additional audience is difficult to determine. What we can theorise is that, since the distribution of the most-viewed moments and live streams were strongly skewed towards outreach activities (e.g., Women’s Day Event, International Space Station Link, Opening Ceremony, Cultural Exchange Evening, Public Astronomy Talks) rather than purely scientific sessions, a portion of this increased audience likely consisted of non-professional public.
The amount of attention and engagement on social media posts related to outreach events (visible in Table 1) suggests a similar proportion made up our social media audience. Of course, while part of the engagement came from attendees, a large segment of interactions probably came from non-specialist public, especially regarding outreach activity, supporting the event’s broader impact, compared to previous editions. The significant support from South Africans, representing approximately 40% of our audience on average, particularly from the Cape Town area, further reinforces these insights, pointing towards the fact that the campaign likely played a role in engaging local communities and raising awareness of the International Astronomical Union. While we were not able to gather reliable data to prove positive behavioural changes in our audience, we can instead reasonably hypothesise an indirect impact. In particular, the main in-person outreach events were primarily advertised through social media channels, and their high attendance (around 3,500 participants) suggests that at least part of this audience was reached and mobilised by our online campaign.
3.3 Lessons learned and recommendations
YouTube open access. The open access format was a success, significantly expanding participation, making the conference more inclusive, and enhancing participants’ experience, when compared to previous IAU GA editions. With more dedicated advertising of the open access livestreams this reach could have been higher, but 7,200 unique viewers against 3,000 conference participants, with a decent retention, can be considered a strong result. It is worth noting that adding YouTube access to the existing Zoom-based online access structure was relatively straightforward, with the setup primarily handled by a single organising committee member, and thus for a low investment of time, effort, and resources it is possible to increase the involvement in the conference and its inclusivity.
Paid advertising. For smaller gatherings without a dedicated social media team, paying to advertise important posts can have a strong impact on public reach. For approximately ZAR 10,000 (∼EUR 500) on Facebook and LinkedIn ads, we achieved around 20% of our campaign’s total reach and directed a portion of the audience to the conference website. In addition, the effort required to set up these ads is relatively low, so with minimal work and relatively modest costs (which vary by country), paid promotion provides an effective way to advertise important events’ moments or deadlines.
Attention toward scientific outreach content. We lack precise data on our audience composition and post-conference information about knowledge changes. Yet, the available evidence suggests that the YouTube open access and social media campaign engaged a larger public than previous IAU conferences. In addition, celebratory posts and outreach-related content consistently outperformed scientific discourse on social media, and many of the ∼3,500 attendees at in-person outreach events likely engaged with these initiatives because of social media promotion. These results suggest that outreach and celebratory content should be central, alongside scientific communication, when planning future campaigns, especially to engage the local public.
Establish early cross-department communication. Around April 2024, the social media team encountered major difficulties in gathering material and content. This led to a decrease in the posting output per week. While communication problems may be normal for major events, lack of awareness of internal and external initiatives prevented the inclusion of potentially valuable content for the audience. To solve the problem, we assigned a volunteer to contact each team of the organising committee (e.g., Outreach, Scientific) asking for specific initiatives and activities they were creating and developing, allowing the development of a direct link between different departments. We recommend establishing this connection between departments at an early stage of the communication campaign to ensure a continuous flow of materials and prevent the loss of content that could be valuable to the public.
Platforms’ performance and tailoring. Lastly, to improve engagement, it would be advantageous to tailor storytelling and content to each platform, where possible. In particular, we suggest maintaining the celebratory and storytelling approach on Instagram while expanding and diversifying content for LinkedIn and TikTok. Refining LinkedIn’s strategy to support networking and professional connections could provide significant benefits, helping early-career researchers, and encouraging international partnerships. Flickr can serve as an image repository and archival tool, much as YouTube can for scientific and outreach live content. For TikTok, given the substantial effort required to build a strong presence, partnering with influencers and science communicators would be a strategic way to reach the public. Lastly, based on our experience, we would recommend four main considerations: focusing on human-centred and celebratory content, preferring carousel to single images, using an informal tone when possible and leveraging public interest in key figures and personalities.
Legacy building. Interest in personalities, events, and activities was particularly high, suggesting an opportunity to extend the conference’s legacy beyond the event itself. We suggest directing the posts and content to adjacent social media accounts to shift attention toward key institutions that can maintain public interest in the conference, by tagging them or resharing their initiatives (in our case, the African Astronomical Society, the South African Radio Astronomy Observatory, and the International Astronomical Union). Another approach could be to repurpose conference platforms for future initiatives (e.g., IAU GA 2027). Ensuring this continuity would not only enhance public engagement but also strengthen the long-term impact of the conference.
3.4 Importance and limitations
This evaluation of the social media campaign and YouTube open access for the IAU General Assembly 2024 provides important insights into how scientific conferences can use social media to amplify public involvement and improve accessibility. It contributes to setting precedents for institutions to share their social media efforts. By contextualising metrics on engagement and experiences, conferences can improve their future outreach initiatives, promote broader public engagement with science and engage public audiences in increasingly meaningful ways. Importantly, the lessons learned here are not unique to an event of this scale. We argue that by making small adjustments, these approaches can be scaled and applied to smaller and larger scientific gatherings, thereby providing practitioners with practical, replicable and affordable strategies.
A limitation of this work is in the analysis of multi-platform social media communication. We lacked the tools and capacity to analyse single-type posts on each platform. In particular, being able to evaluate which post and content performed best, would have been highly beneficial for optimising our communication strategies for future events. Additionally, platforms like X and Bluesky have paywalls to deny access to the data or completely lack the metrics altogether, contributing to aggravating the issue. Additionally, for upcoming gatherings, we suggest improving accessibility by partnering with experts’ association to expand and enhance the campaign’s features for all users.
This study is also limited by the absence of benchmark data from other similar conferences. Without historical data, it is difficult to gauge the campaign’s performance. While we can say that we reached a larger section of the public compared to previous events, and most likely increased astronomy awareness and IAU visibility, we cannot assess changes in attitudes or behaviours within the newly reached public, aside from noting those attending in-person events. However, structured evaluation output of this kind represents a first step for IAU conferences and other scientific gatherings to benchmark against. In conclusion, by sharing these results, we hope to encourage other institutions to implement similar strategies, thereby building a shared knowledge base and supporting more structured data gathering for stronger scientific social media outreach in the future.
Acknowledgments
The authors would like to thank the two reviewers and the editors for their precise, constructive and crucial suggestions, which significantly improved the paper. In addition, they thank the National Organising Committee, the social media team, as well as the conference partners and sponsors. Among them, we especially thank Ramasamy Venugopal for his guidance, Lisa Di Carlo for her constant support, and Daniel Cunnama and Kevin Govender for their suggestions.
References
-
Albrecht, S. S., Aronowitz, S. V., Buttenheim, A. M., Coles, S., Dowd, J. B., Hale, L., Kumar, A., Leininger, L., Ritter, A. Z., Simanek, A. M., Whelan, C. B., & Jones, M. (2022). Lessons learned from Dear Pandemic, a social media-based science communication project targeting the COVID-19 infodemic. Public Health Reports®, 137(3), 449–456. https://doi.org/10.1177/00333549221076544
-
Bhanye, J., Shayamunda, R., & Tavirai, R. C. (2023). Social media in the African context: a review study on benefits and pitfalls. In R. Baikady, S. M. Sajid, J. Przeperski, V. Nadesan, M. R. Islam & J. Gao (Eds.), The Palgrave handbook of global social problems (pp. 1–32). Palgrave Macmillan. https://doi.org/10.1007/978-3-030-68127-2_366-1
-
Cunnama, D. (2023, October 31). The world’s largest international astronomy meeting will be held in Africa and open to the public for the first time! IAU General Assembly 2024. https://astronomy2024.org/
-
Cusick, J. A., George, E. A., Greenway, E. V., Watve, M., Graham, K., & Raby, C. L. (2024). Is it time to get over the X? Assessing the global impact and future of social media conferences in animal behaviour. Animal Behaviour, 213, 33–50. https://doi.org/10.1016/j.anbehav.2024.04.001
-
Duncan, N. W., & Shean, R. (2023). Analysing the effectiveness of Twitter as an equitable community communication tool for international conferences. PeerJ, 11, e15270. https://doi.org/10.7717/peerj.15270
-
Gilavand, A., Fakhri, F., & Seyedtabib, M. (2023). Evaluating the attitude of medical students toward the impact of social media on improving learning and increasing awareness during the Covid-19 pandemic: a cross-sectional study in Iran. Health Science Reports, 6(6), e1364. https://doi.org/10.1002/hsr2.1364
-
Google Support. (2025). About YouTube ads and view metrics. YouTube Help. https://support.google.com/youtube/answer/2375431?hl=en
-
Govender, K., Takalana, C. M., McBride, V., Venugopal, R., Moss, V. A., Blumenthal, K., Mdhluli, J. E., Chibueze, J. O., Macfarlane, S. A., Benkhaldoun, Z., Rees, G., Le Jeune, A. J., Barocci-Faul, S., Binneman, A., Breytenbach, H., Cunnama, D. C., Girolamodibari, A., Kobayashi, R., Kubheka, D. V., … Zamxaka, M. (2025). A historic XXXII IAU General Assembly for a lasting African legacy. Nature Astronomy, 9(1), 2–5. https://doi.org/10.1038/s41550-024-02447-w
-
Halpern, M., & O’Rourke, M. (2020). Power in science communication collaborations. JCOM, 19(04), C02. https://doi.org/10.22323/2.19040302
-
IAU General Assembly. (2024). Day 1 — August 6. https://astronomy2024.org/day-1-august-6/
-
Keegan, B. J., & Rowley, J. (2017). Evaluation and decision making in social media marketing. Management Decision, 55(1), 15–31. https://doi.org/10.1108/md-10-2015-0450
-
Kubheka, D., & Macfarlane, S. (2024). Explained in 60 seconds: community engagement at the XXXII IAU General Assembly. Communicating Astronomy with the Public Journal, 35, 4–5. https://doi.org/10.5281/zenodo.14986837
-
Mackenzie, G., Murray, A. D., & Oliver, C. W. (2018). Virtual attendance at an international physical activity meeting using Twitter: how can data visualisation provide a presence? British Journal of Sports Medicine, 52(6), 351–352. https://doi.org/10.1136/bjsports-2016-097373
-
Moss, V. A., Venugopal, R., Govender, K., Hotan, A. W., Kobayashi, R., Rees, G. A., Tasker, E. J., Vertue, D. G., Le Jeune, A., Kerrison, E. F., Roux, J., Blumenthal, K., Ekers, R. D., Peel, M. W., Takalana, C. M., Barocci-Faul, S., Benkhaldoun, Z., Binneman, A., Breytenbach, H., … van Zyl, L. (2025). Accessible hybrid conferences are possible and affordable at large scale. Nature Astronomy, 9(1), 6–10. https://doi.org/10.1038/s41550-024-02448-9
-
Mueller-Herbst, J. M., Xenos, M. A., Scheufele, D. A., & Brossard, D. (2020). Saw it on Facebook: the role of social media in facilitating science issue awareness. Social Media + Society, 6(2). https://doi.org/10.1177/2056305120930412
-
Newman, T. P., & Beets, B. (2023). Exploring the brand of science: implications for science communication research and practice. JCOM, 22(02), A05. https://doi.org/10.22323/2.22020205
-
Power, B. J. (2022). How to use Twitter at a scientific conference. mSphere, 7(3), e00121-22. https://doi.org/10.1128/msphere.00121-22
-
Quelle, D., Denker, F., Garg, P., & Bovet, A. (2025). Why academics are leaving Twitter for Bluesky. arXiv. https://doi.org/10.48550/arXiv.2505.24801
-
Shetty, M., Aggarwal, N. R., Parwani, P., Bucciarelli-Ducci, C., Lopez-Mattei, J., Choi, A., & Grosse-Wortmann, L. (2022). Social media to enhance engagement and science dissemination during in-person and virtual medical conferences: the SCMR 2020 and 2021 experiences: a report of the SCMR social media task force. Journal of Cardiovascular Magnetic Resonance, 24(1), 15. https://doi.org/10.1186/s12968-021-00837-x
-
Trunfio, M., & Rossi, S. (2021). Conceptualising and measuring social media engagement: a systematic literature review. Italian Journal of Marketing, 2021(3), 267–292. https://doi.org/10.1007/s43039-021-00035-8
-
Wang, Y., McKee, M., Torbica, A., & Stuckler, D. (2019). Systematic literature review on the spread of health-related misinformation on social media. Social Science & Medicine, 240, 112552. https://doi.org/10.1016/j.socscimed.2019.112552
-
Weingart, P., Joubert, M., & Connoway, K. (2021). Public engagement with science — origins, motives and impact in academic literature and science policy. PLoS ONE, 16(7), e0254201. https://doi.org/10.1371/journal.pone.0254201
-
Wong, A., Ho, S., Olusanya, O., Antonini, M. V., & Lyness, D. (2021). The use of social media and online communications in times of pandemic COVID-19. Journal of the Intensive Care Society, 22(3), 255–260. https://doi.org/10.1177/1751143720966280
About the authors
Andrea Girolamodibari is an astronomy communicator dedicated to using astronomy as a tool for development and making science accessible through inclusive outreach. Passionate about engaging diverse communities, he explores creative ways to connect with the public, especially through social media.
E-mail: andre.girolamodibari@studio.unibo.it
Vanessa Moss is Head of ASKAP Science Operations at CSIRO and an experienced radio astronomer. Her work spans research, operations, and science communication, and she is involved in The Future of Meetings initiative on hybrid interaction practices in scientific meetings.
E-mail: Vanessa.Moss@csiro.au