

1 Introduction
Over the last several decades, leaders from the global scientific community have urged their colleagues to increase their engagement and communication with various publics [National Academies of Sciences, Engineering, and Medicine, 2017]. The motivation for encouraging more communication stems from a desire to ensure continued support for public funding of scientific research, to value the use of scientific evidence in policy-relevant and personal decision-making, and overall, to reinforce strong attitudes toward science and the scientific process.
Yet, with a growing number of scientists and other experts increasing their attention to public engagement and communication [Entradas et al., 2020; Weingart, Joubert & Connoway, 2021], there remains a lack of understanding about how the fundamental meaning of science is perceived and why [Newman, 2020]. This goes beyond just looking broadly at how one views the risks and benefits of science [e.g., National Science Board, 2018], optimism and pessimism toward science [e.g., Nisbet & Markowitz, 2014], or overall levels of confidence or trust in science [e.g., Krause, Brossard, Scheufele, Xenos & Franke, 2019]; it is understanding the collective meanings that different publics attach to science.
One avenue of research that provides a promising direction is the positive and negative associations that Americans have with science. Previous studies based on focus groups and confirmed by nationally representative public opinion surveys, find that when respondents are asked about what they feel when they hear the word science, hope is the answer that is brought up most frequently [ScienceCounts, 2015, 2020]. However, these surveys relied on a multiple-choice measure, requiring respondents to choose only one emotion. The extent to which there is variance in respondents’ connection to these different emotions requires survey items that measure the intensity of their feelings toward each emotion. Moreover, little is known about how these feelings about science connect to the different ways that various publics think about science, and the needs and benefits that they associate with science.
We acknowledge that the questions we seek to address are complex. Science may elicit different meanings to different publics, making it difficult to put science into a category of its own. After all, science is both a body of knowledge and a process. We know from ongoing research in survey methodology that questions that probe respondents’ trust, support, or perceptions of science are contingent on the field of science and/or its potential application [McCright, Dentzman, Charters & Dietz, 2013; Reif & Guenther, 2021]. The multidimensional aspects of these questions make it difficult to measure, thus making comparisons over time and contexts challenging [Krause et al., 2019]. Nonetheless, a pathway forward requires science communication practitioners and researchers to have a baseline of what attitudes science elicits among respondents.
The purpose of the current exploratory study is to uncover these meanings of science among a sample of American respondents, and, in turn, how this information can inform the efforts of researchers and practitioners communicating about science across different disciplines. The unique contribution of this research is to integrate the Brand Concept Management (BCM) framework with science communication theory and practice to aid in understanding the extent to which and in what way a consistent meaning of science exists. This paper builds on previous descriptive research measuring how audiences attach meaning to science by examining responses to different brand constructs adapted for the context of science.
2 Context
2.1 From science schema to emotional connections to science
Previous research shows how one’s mental model — or schema — explain how audiences process science related information, and shape attitudes and perceptions of science, broadly, and science issues, specifically. One’s schema is made up of various attitudes, beliefs, and worldviews that act as a heuristic — or cognitive shortcut — to make sense out of complex information [Scheufele, 2006]. Because non-scientists may not have the expertise or background to scrutinize complex science information, schema help guide in the processing of information, and help unpack the affective meanings of science among the public. For example, what are the different emotional connections individuals have with science, and what can they reveal about the extent to which a fundamental meaning of science exists? Emotions are a fundamental starting point to our evaluative reactions to different objects, persons, or ideas and a key motivator behind our differences in thought. Emotions help guide our heuristics and information processing, influencing one’s level of elaboration [Cacioppo & Petty, 1989; Nabi, 1999].
How one thinks and feels about science may seem rudimentary given the abundance of studies in science communication on audience segmentation [e.g., Besley, 2018; Metag & Schäfer, 2018; Scheufele, 2018]. But if the scientific community does not understand how science is perceived and why, it hinders even the most basic efforts to shape the emotional connections that the public has with science. How this is managed is a task that rests not just on professional science communicators, but the various actors at the science-society interface.
While there are several emotional states that are useful for understanding communication-based phenomena related to science, here we focus on two positive emotional states — hope and joy — and two negative emotional states — fear and caution. We suggest that these emotions may be grouped into pay-off minded orientations and process-minded orientations. Pay-off minded orientations are emotional states that orient towards the applications of science, or how the collective body of scientific knowledge is applied. For example, hope is a feeling or expectation for a certain thing to happen [Snyder, 1995; Snyder, Lopez, Shorey, Rand & Feldman, 2003]. Hope is a complex emotion [for a review, see Redlich-Amirav, Ansell, Harrison, Norrena & Armijo-Olivo, 2018] that is not new to science communication research [e.g., Nabi, Gustafson & Jensen, 2018]. Fear, on the other hand, may be linked to more pessimistic judgements and anger towards outcomes [Lerner & Keltner, 2001].
In contrast, process-minded orientations are emotional states that orient to the day-to-day activities of doing science, or a way of discovering that leads to an understanding of the natural world. Joy, which is a similarly complex emotion, refers to one’s overall feeling of pleasure or happiness [for a review, see Johnson, 2020]. Within the context of science, joy is in part motivated by participating the day-to-day activities of science. This emotional state is also common in informal science education and engagement, as joy is associated with hands-on activities surrounding science [Volpe, Klein & Race, 2022]. On the other hand, caution suggests hesitancy, and like fear, an affective state of stress [Cacioppo, Berntson, Larsen, Poehlmann & Ito, 2000]. Therefore, we hypothesize:
-
Compared to joy, fear, caution, and boredom, hope is the emotion with the strongest positive association to science.
However, it is important to acknowledge that science is not monolithic. For example, do emotional associations with science vary across different subfields of science, such as astronomy and chemistry? To explore this question, we ask:
-
What are the emotions most positively associated with specific subfields of science?
2.2 Brand concept management and science communication
In addition to one’s emotional associations with science, theories and frameworks from branding provide a conceptual and theoretical lens to examine how the public thinks and feels about science. Branding seeks to uncover the emotional, sensory, and cognitive meanings when a person first encounters an object, person, or idea [for an overview, see O’Guinn, Muñiz & Paulson, 2019]. As a marketing tactic, various entities carry out extensive research to understand their brand image within the consumer marketplace and use this knowledge to differentiate and position themselves in the minds of consumers [Newman & Newman, 2018; Urde, 2016] In other words, the needs a brand meets for a consumer.
Brand concept management (BCM) provides a normative framework for selecting, implementing, and controlling a brand image over time, and has been applied to several consumer product and service contexts [Payne, Frow & Eggert, 2017]. A brand concept refers to the “general meaning associated with a brand” [Park, Jaworski & MacInnis, 1986, p. 136], which is intended to fulfill a specific consumer need. These needs can be grouped into three categories: functional, symbolic, and experiential [Park et al., 1986]. Importantly, these categories are not mutually exclusive.
Functional needs refer to the product attributes that provide some type of functional utility to the consumer (e.g., solves or prevents a potential problem). Prior research in branding has measured functional aspects of a brand in terms of performance and quality [e.g., Delgado-Ballester & Fernandez Sabiote, 2015] and price value [e.g., Sweeney & Soutar, 2001]. For example, in the context of purchasing a car, a factor that motivates one’s purchasing decision is the need for transportation to get to work. Experiential needs refer to the positive feelings experienced by a customer through the purchase and/or use of a product. The experiential concept has been measured in terms of a brand’s sensory, emotional, intellectual, and behavioral dimensions [e.g., Brakus, Schmitt & Zarantonello, 2009; Chang & Chieng, 2006; Delgado-Ballester & Fernandez Sabiote, 2015]. When purchasing a car, one may be motivated to choose a car with excellent steering and horsepower, providing the consumer a certain type of driving experience. Finally, symbolic needs refer to how a product conveys one’s self-image. These are internally generated needs (e.g., ego-identification) that help to associate the individual with a specific desired group or self-image. When purchasing a car, one may be motivated to choose a specific brand or model based on this desire.
So, how is the BCM framework useful for science communication? Science — as an institution — is frequently put on a pedestal as one of the most trusted institutions. This is indeed the case in the United States, as surveys consistently find broad support for science funding, benefits of scientific research, and trust in scientists [Southwell & White, 2022]. But what are the needs and benefits that individuals associate with science? For some, science may serve a functional purpose (e.g., science leads to new medicines), while for others it may be experiential (e.g., the joy and excitement of doing or learning about science). Science may also serve as a symbolic representation, standing in as a type of identity marker (such as the common slogan, “I stand with science”), or as an attachment to symbolic images relating to science (e.g., the Apollo 11 Moon landing).
Understanding these different connections to science, and to what extent and in what way they manifest across respondents is an important yet overlooked aspect of the science communication process. Given the current context of “post-normal” science, where the application of scientific knowledge and the process of scientific discovery are laden with uncertainty and moral and value considerations [Funtowicz & Ravetz, 1991], there is a need to elaborate and fortify what needs and benefits science provides. Therefore, we propose the following research questions:
-
What are the different ways that Americans describe the functional, symbolic, and experiential concepts of science?
-
Which themes (i.e., applications, experiences, images, and attitudes) appear most frequently within the different brand concepts of science (i.e., functional, experiential, symbolic)?
3 Methods
To better understand how people emotionally connect to science and how they think about the functional, experiential, and symbolic constructs of science, we conducted two surveys of the American public through Amazon Mechanical Turk (MTurk). The first survey, which we refer to as the science survey, explored attitudes towards science generally. The second survey, which we refer to as the subfields survey, explored attitudes towards five specific subfields of science: astronomy, biology, chemistry, engineering, and psychology.
3.1 Survey design and samples
Science survey. Before fielding, the science survey was pre-tested by members of our research group. Next, we conducted a small pilot survey in March 2021 to test our open-ended questions about the brand concepts of science. For the pilot, a sample of 41 respondents aged 18 or older from the United States were recruited via MTurk and paid $2.00 for their participation. As part of the pilot survey, participants were asked three separate open-ended questions about what comes to mind when they think about the “benefits of science” (functional), how they “experience science” (experiential), and “images of science” (symbolic). The order of these questions was randomized to reduce priming effects. The pilot test indicated that the open-ended questions elicited unique responses across the three questions.
The full science survey was fielded on MTurk in April 2021 and programmed using the Qualtrics survey platform. Participants were paid $2.00 to complete the survey. The initial sample included 1021 participants aged 18 or older from the United States. After filtering responses for a completion rate of 85% or greater, which limited the sample to respondents who answered the demographic questions, the sample was reduced to 952. Of the remaining responses, an additional 164 were excluded from the open-ended analysis because the responses did not adhere to the survey instructions. For example, the responses were blank, copied and pasted from an external source (e.g., Google search results), or they simply repeated the prompt text. Therefore, the final sample for the open-ended analysis included 788 responses.
Subfields survey. The science subfields were selected to represent common, but diverse, disciplines: astronomy, biology, chemistry, engineering, and psychology. The survey was conducted on MTurk in June 2021 and programmed using the Qualtrics survey platform. The sample included 506 participants aged 18 or older from the United States. Participants were paid $2.00 to complete the survey. The aim of this survey was to explore RQ2 and the emotional associations with science, therefore the survey did not include the open-ended or demographic questions (see below). Participants were randomly assigned to receive questions related to one of the five subfields of science.
3.2 Survey measures
Emotional associations (science and subfields surveys). To measure emotional associations for the science survey, respondents were asked “how often do the following words come to mind when you think about science?” Responses were measured on a 5-point scale from 1 = “not at all” to 5 = “a lot” and the emotions included: hope, joy, caution, boredom, and fear. For the subfields survey, respondents received the same prompt with the word “science” replaced with one of the five fields of science. This measure was adapted from ScienceCounts [2015].
Open-ended brand concepts (science survey only). Participants were randomly assigned to receive one of three open-ended questions relating the three brand concepts: functional, experiential, or symbolic. To measure the functional brand concept, respondents were asked to “write a few sentences about what comes to mind when you think of the benefits of science”. For the experiential brand concept, respondents were asked to, “write a few sentences about what comes to mind when you think of the different ways that you experience science”. Finally, to measure the symbolic brand concept, respondents were asked to, “write a few sentences about what images come to mind when you think about science”.
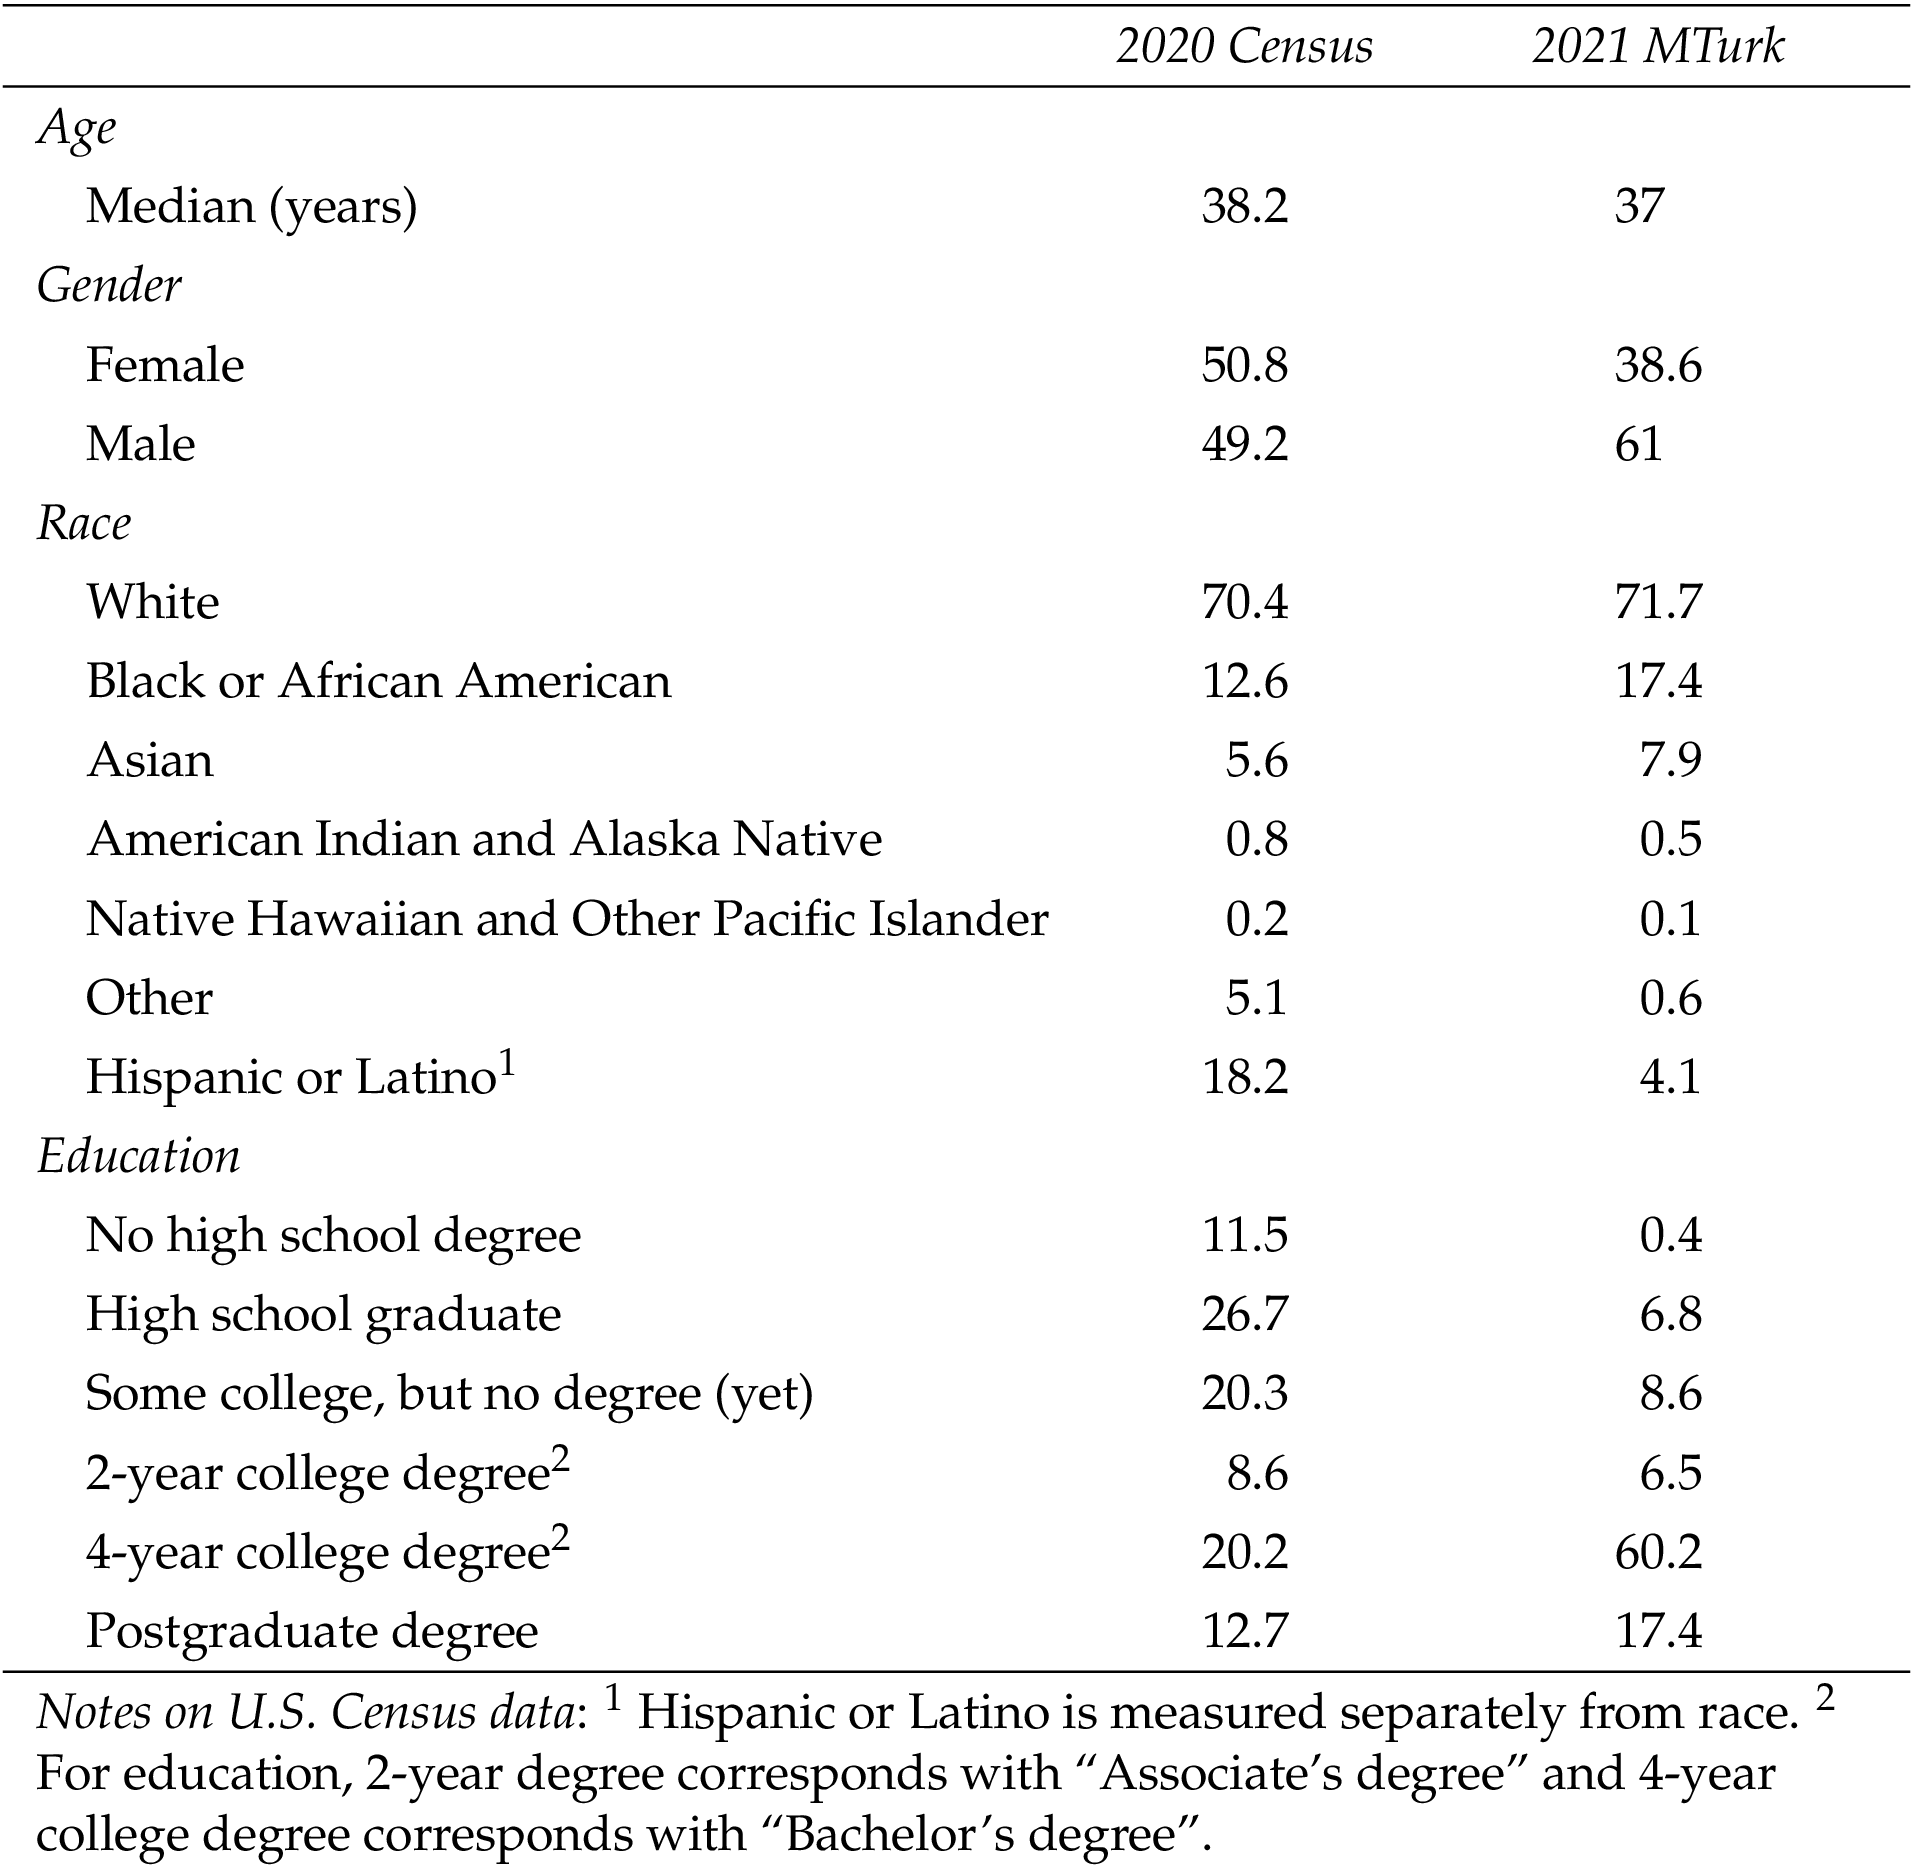
Demographics (science survey only). Our demographic measures included age, gender, race, education, and political ideology. Age measured respondents’ age in years (, median ). The measure for gender included male (61%), female (38.6%), and non-binary (0.4%). To measure race, participants were asked “what racial or ethnic group best describes you?” Responses included White (71.7%), Black or African American (17.4%), Asian (7.9%), Hispanic or Latino (4.1%), American Indian or Alaskan Native (0.5%), Native Hawaiian or Other Pacific Islander (0.1%), and other (0.6%). Education measured respondents’ highest level of education completed. Responses included no high school degree (0.4%), high school graduate (6.8%), some college, but no degree (yet) (8.6%), 2-year college degree (6.5%), 4-year college degree (60.2%), postgraduate degree (17.4%). Table 1 includes a comparison of our sample with the demographic data from the 2020 U.S. American Community Survey [U.S. Census Bureau, 2020].
It is necessary to acknowledge that while MTurk is widely used for social science research [Thomas & Clifford, 2017], participants’ demographic characteristics tend to differ from the general U.S. population [e.g., Huff & Tingley, 2015]. As can be seen in Table 1, our sample tends to be slightly younger, more male, and more educated than the U.S. population.
4 Analysis
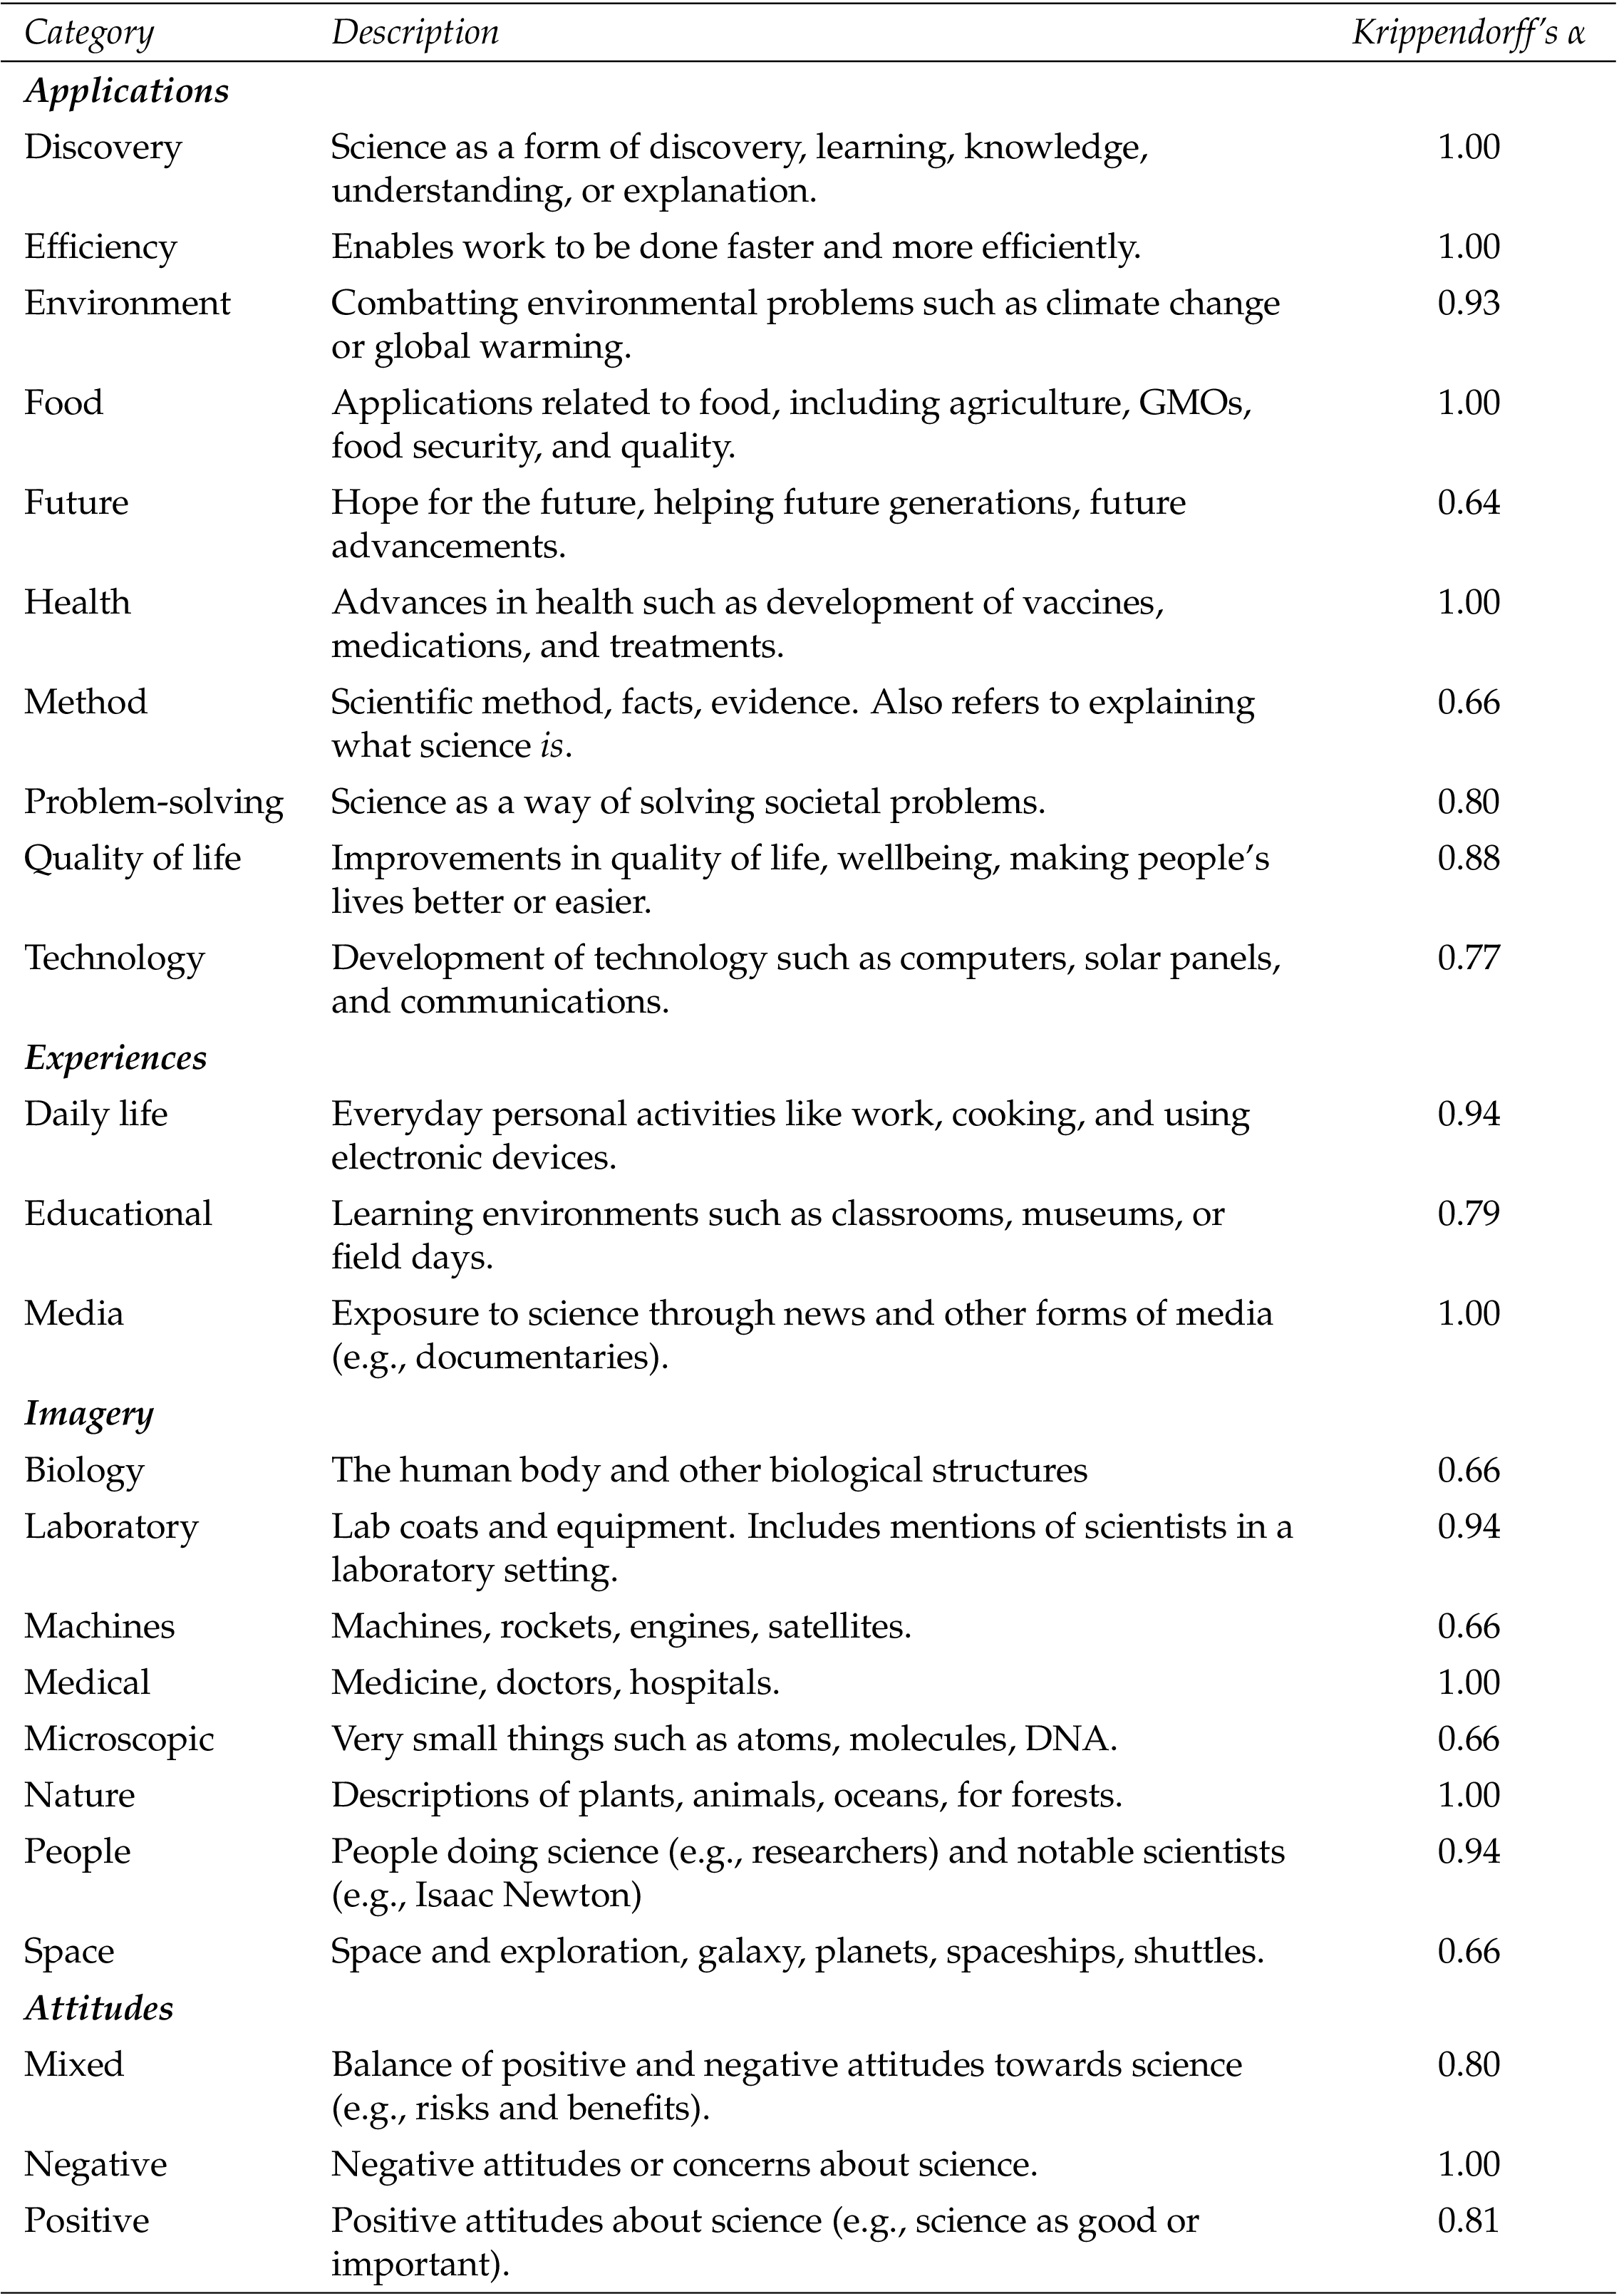
Statistical analyses were conducted using IBM SPSS Statistics. The qualitative analysis of the open-ended survey responses was conducted with NVivo. For our open-ended analysis, we used an inductive and deductive approach to identify and code common themes in the open-ended survey responses [Braun & Clarke, 2006]. As new themes emerged, responses were recoded. One member of the research team coded the initial responses and coding categories were reviewed and refined by both members of the research team. To ensure reliability of the measures, both members of the research team coded a sample of responses from each condition. Using Krippendorff’s alpha, reliability for the variables ranged from .64 to 1.0 (values are reported in Table 2). Because there are no preexisting coding strategies for the brand concept management framework, the use of inductive analysis was required to develop the categories. In total, four broad themes and 24 sub-categories were developed (see Table 2). Responses that were unclear or that did not fit into an existing coding category were coded as “other”. Multiple codes may appear within each unique response therefore coding was not mutually exclusive.
5 Results
5.1 Emotional associations with science
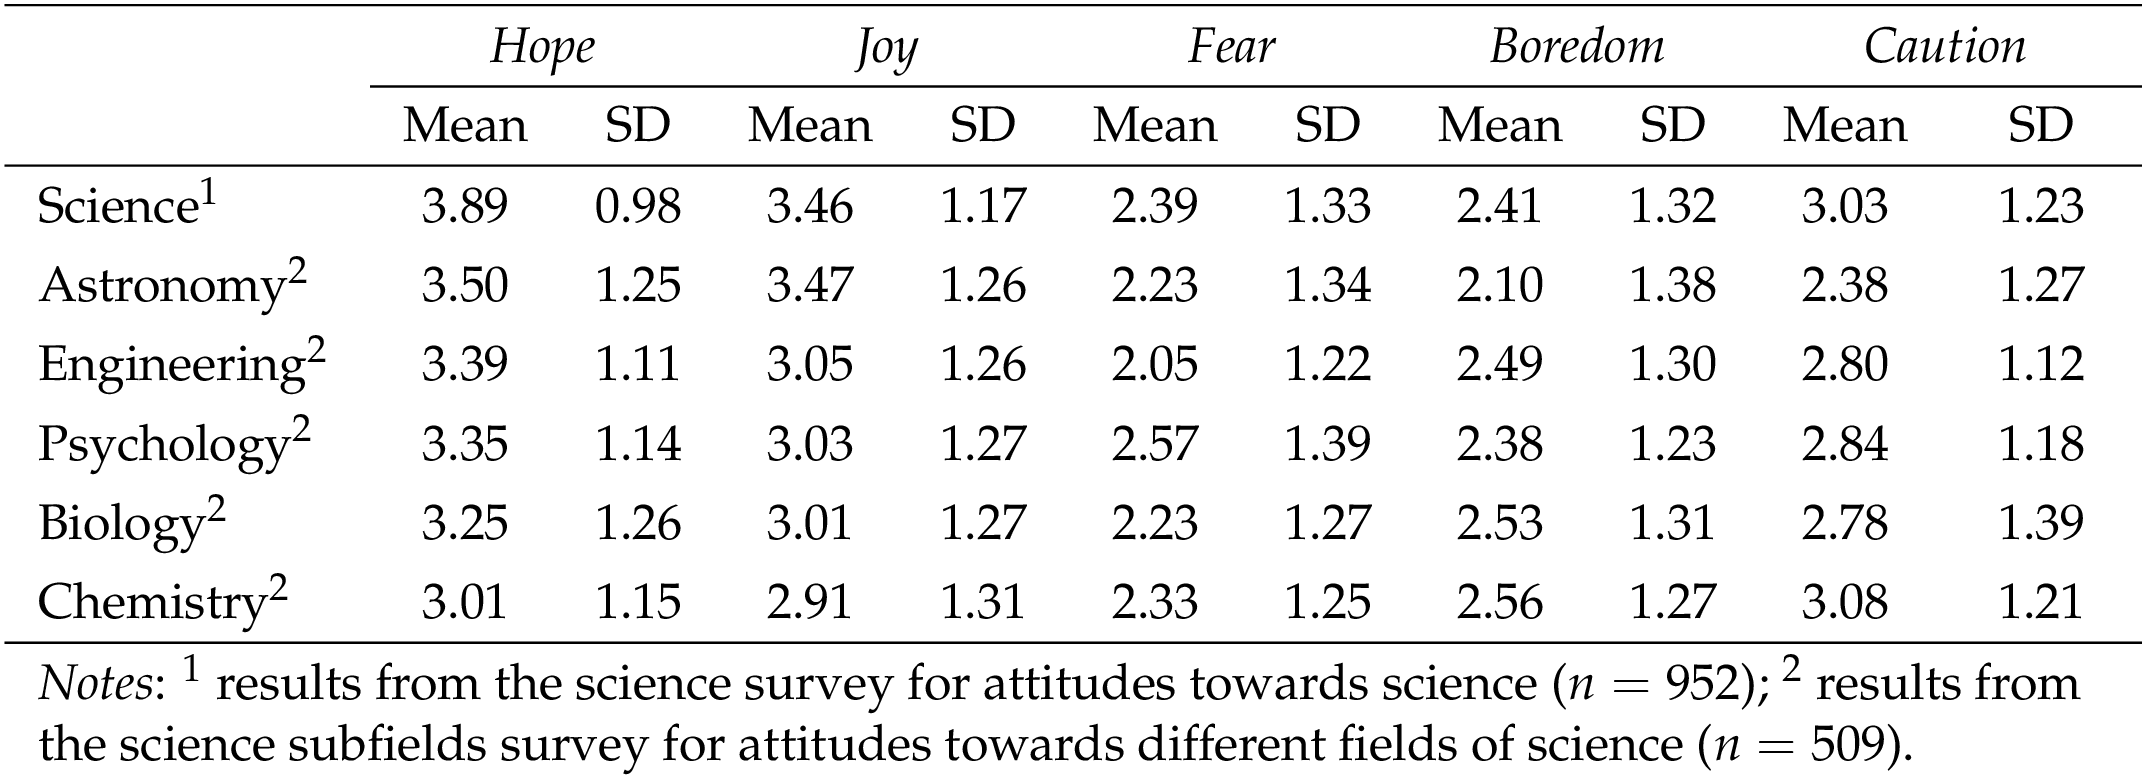
To begin, we report on the results of our science word associations. As we expected (H1), results from the science survey indicate that hope is the word that most often comes to mind when individuals think about science (, ), followed by joy (, ). Caution (, ), boredom (, ), and fear (, ) were less likely to be associated with science. While these differences are not statistically significant, the baseline patterns do align with our expectations from previous research. For the science subfields survey (RQ1), we found that except for chemistry, hope is the word that most often comes to mind when individuals think about biology, astronomy, engineering, and psychology. For each of these four subfields, hope was followed by joy and then caution. In contrast, for chemistry, the word that most often comes to mind is caution, followed by hope and then joy. A comparison of the mean responses for science and the science subfields is reported in Table 3.
5.2 Brand concepts of science
Four broad themes emerged in coding the open-ended responses from the science survey on the functional, symbolic, and experiential concepts of science (RQ2): applications, experiences, images, and attitudes. Across each of the four themes, slightly less than half of respondents mention applications (47.9%), followed by images (23%), experiences (17.1%), and attitudes (12%). Each of these themes is described in greater detail below along with example responses with the coding categories in brackets.
5.3 Theme 1: applications of science
The applications theme broadly refers to the practical or functional uses of science. This theme can be further separated into mentions of direct applications of science, such as vaccine development, and more general applications, such as solving complex problems. Responses within this theme are evenly split between direct and general applications. The most mentioned direct applications relate to health and technology, with responses often including multiple specific examples.
Medical advances through scientific research and development have led to medications, vaccines, and treatments that enable longer lives. (Health)
I think about all the technological advances made because of science, things like cars, planes, trains, TV’s, cell phones, computers. I think lives are made better by science. (Technology)
Other commonly cited direct applications relate to food and the environment. For instance, several respondents mention the benefits of science in combatting climate change as well as improving access to food.
I am counting on scientists to continue to do the good work to help us combat climate change. I feel that they have a big steak [sic] in helping us to understand the dire situation we are in. (Environment)
Food science technology improves not only the quality and abundance of food, but also the diversity of food. (Food)
The applications theme also includes more general applications of science such as references to discovery and learning and improvements to quality of life. These two sub-categories account for about two thirds of the general application responses.
Learning more about the world we live in and how it works. answers to the most mysterious questions of our time. (Discovery)
I am thinking of the advances made in the field of science and technology that have had a huge impact on the quality of life in the areas of agriculture, industry, medicines, cures for diseases, space travel and longevity to name just a few… (Quality of life)
Other responses relate to the use of science to solve problems or increase efficiency. There are some references to aspects of the scientific method, such as inquiry or observation, that enable science to function.
When I think of science I think of solving complex problems. Science can answer questions we have been searching for for [sic] a long time. (Problem-solving)
Scientific research can identify more efficient ways of doing things. (Efficiency)
When I think about science I think about experiments and hypotheses. (Method)
5.4 Theme 2: experiences with science
The experience theme reflects responses focused on how individuals engage or interact with science. For example, there are references to experiencing science in daily life, through the media, or when participating in educational activities such as attending a science fair or class. Almost two-thirds of responses mention experiencing science through daily activities such as driving a car, using a phone, taking medicine, and cooking food.
The way we experience science is ubiquitous. We feel it everyday from waking up in the morning by an alarm clock from our phones to going to work via vehicle. It is astounding how science plays a role everywhere. (Daily life)
I experience it everyday in the technology that surrounds me, in the food that I eat, the medicine that I take, and in the news that I read and watch. (Daily life)
References to experiences with science stemming from educational activities account for almost of quarter of responses.
I think about the different things I’ve done in my science classes in college, like collecting lichens in field ecology class and looking at the different lichens I’d found to try to identify their species, and all the interesting tidepool creatures our class found when our invertebrate biology class went on a field trip to the tidepools at a minus tide. (Educational)
Other times when I feel like I am actively experiencing science is when I am at a museum that deals with science-related topics. (Educational)
Finally, some responses mention experiencing science through the media, such as through the news, reading articles, or watching science documentaries.
I read a lot of news and am interested in science so every now and then I read about scientific research studies or see news about some new breakthrough, like how NASA recently flew a small helicopter on Mars. I experience science as like a detached observer, I think. (Media)
The way I experience science is now is through news article about stories like climate change, pandemic, etc. I read it and just take it on a surface level rather than really go deep (except for the covid pandemic which I felt like I absorbed myself into learning about what a virus is and how vaccines work, etc.). (Media)
5.5 Theme 3: images of science
The third theme that emerged was images of science, or visuals that individuals associate with science. About a third of responses include descriptions of laboratory settings such as people working in labs or items that are typically found in lab environments including beakers and test tubes.
Images of laboratories comes to mind — beakers filled with chemicals, people in white lab coats, a cage with mice in it. I also think about someone at a computer working on equations or inputting code. (Laboratory)
When I think about science, I get sort of stock-image visuals as a knee-jerk reaction. So, I see like a guy in a white coat looking through a microscope, or a woman in safety-glasses looking at beakers and test tubes and such. I also see sort of general “science-y” items, like a DNA double helix, or charts, or lone beaker/test tube/chemistry stuff, maybe some random equations. (Laboratory)
Mentions of people included scientists and technicians, doctors or nurses, and famous scientists such as Albert Einstein and Isaac Newton. About twenty percent of the responses coded as images include direct mentions of people.
When I think about science I see images of people in lab coats working hard in a glassed in room. I see images of somebody important looking standing in front of a room full of people telling them about the latest scientific breakthrough (People)
When I think about science I think about Galileo looking through a telescope and learning new secrets about our universe. (People)
Lastly, about thirty percent of responses include descriptions of space or nature, such as planets, forests, or oceans.
When I think of science I think of space. This long dark never ending space with little specks of bright light along the way. (Space)
When I think of science, a stream of ’natural’ images flow through my mind. I think about flowers, plants, or walking through a forest. I also think of different animals, like birds, mammals, lizards, or fish. I think about oceans and waterfalls, as well as the night sky and outer space. (Nature)
5.6 Theme 4: attitudes about science
The final broad theme reflects individuals’ attitudes towards science. This includes responses with either positive, negative, or mixed descriptions of science. While some responses indicate a positive or negative valence toward a specific application, experience, or image of science, others simply reflect a general attitude about science (e.g., “I find it exciting”). Mentions of the positive aspects of science account for three quarters of these responses and include descriptions such as science being essential, important, or exciting.
With the ever changing world I believe that science is essential for all of us. Whether it is sending an unmanned spacecraft to Mars or exploring the depths of the ocean to look for new creatures, it benefits all of mankind. (Positive)
I also personally see it as an intrinsic good outside of its ’usefulness’, i.e. satisfying human curiosity. (Positive)
In contrast, negative responses tend to emphasize the risks of science, ethical concerns about its use, or reflections on bad experiences with science.
When I think of science, I think of pure disgust. Science confuses me, and therefore, I am uninterested. Thinking about science brings me back to 10th grade biology class where I had to dissect frogs, squid, pig fetuses. (Negative)
I think of a crazy lab technician that is doing everything possible to control the world and his natural surroundings, even if this leads to detrimental effects on mankind that he cannot even fathom. (Negative)
Those responses coded as mixed typically contrast or weigh the negative and positive aspects of science, such as the risks and benefits of emerging technologies like artificial intelligence.
Artificial intelligence comes to my mind. I can imagine how AI can influence human life and make it more exciting. A bit of caution also comes to mind with the fear that AI should be within moral bounds and bias. (Mixed)
The many benefits of science are always two-fold, as we are able to live longer, shop easier, have research at our fingertips; however, the great things we are doing for the human race — the amount of lives saved — is outweighed by the destruction to our planet. We do not know the repercussions of science, as we know it today. (Mixed)
5.7 Exploring themes across treatment groups
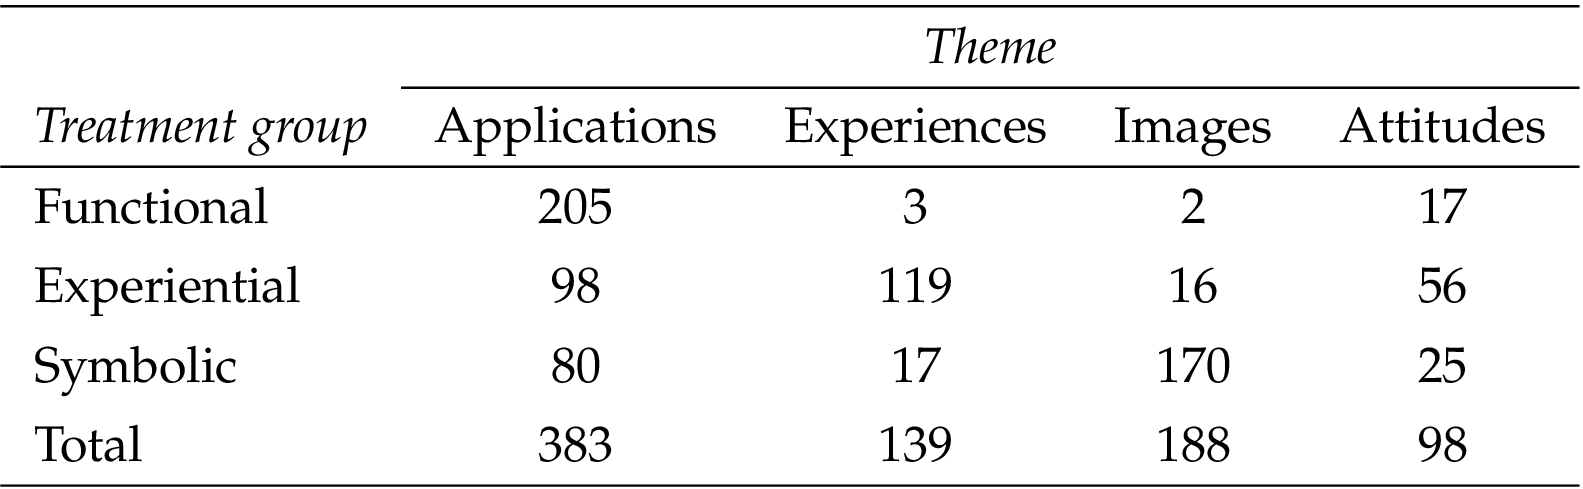
To explore the themes that appear most frequently across the three concepts of science (RQ3), we report on the distribution of responses by treatment group (see Table 4 for a breakdown). It is important to note that our analysis of the open-ended responses is qualitative and not meant to suggest causal relationships. While three of the four themes map closely onto the functional, experiential, and symbolic concepts, responses are somewhat varied across treatment groups. First, most responses to the prompt about the benefits of scientific research (functional) include applications of science. Likewise, about two-thirds of responses to the prompt about the images of science (symbolic) include references to specific imagery (e.g., space, laboratory, etc.). Whereas individuals who received the functional and symbolic concepts are more likely to have responses that align with their prompt, the responses among participants who received the experiential treatment are more mixed. When asked about how they “experience science” (experiential), just under forty percent of responses mention experiences, followed by applications, with relatively fewer responses coded as images. Interestingly, we do see themes related to the functional applications of science arise even if people received the experiential or symbolic prompts. Over half of the responses coded as attitudes are from those who received the experiential prompt.
5.8 Limitations
Before discussing the implications of our results, we must address several limitations of these data. First, this study used non-probability samples, which limits the generalizability of the findings to the U.S. population. Additionally, while some studies demonstrate the potential benefits of using MTurk samples, such as increased attentiveness to instructions relative to traditional student samples [e.g., Hauser & Schwarz, 2016], others flag issues with data quality when compared with other online survey vendors [e.g., Peer, Rothschild, Gordon, Evernden & Damer, 2022]. Second, while open-ended responses that were copied and pasted from web searches were removed from the analysis, it is possible that not all were identified and removed. Third, the functional open-ended response question was positively framed, while the questions for experiential and symbolic did not indicate any valence. This may affect the results by suggesting respondents answer more positively. However, the results in Table 4 suggest that there is less variance in attitudes in the functional condition compared to the experiential or symbolic conditions. Finally, the COVID-19 pandemic was ongoing during the fielding of the surveys, and given heightened public attention to the issue, may frame the way that respondents think and feel about science.
6 Discussion and future directions
Despite these limitations, this exploratory analysis provides worthwhile avenues to uncover different branding concepts connection to science. The findings also highlight the importance of the different contexts and emotions being measured when respondents are asked about their attitudes towards science. First, the finding that hope is the word that comes to mind most often when respondents think about science, broadly, and different scientific fields, specifically, suggests an orientation towards the functional aspects of science. This finding confirms previous research, even when using Likert-scales rather than single-response items to measure one’s emotional connect to science. Hope is the expectation for a certain outcome to occur in the future [Snyder, 1995], and responses to the open-ended questions on the benefits of science support this. Interestingly, in the open-ended responses the theme of “application” appeared frequently for respondents who received the functional as well as the experiential condition. This suggests more evidence to the notion that science is a utility that takes on meaning to the public when it is connected to an issue that they care about. In other words, science is a means to achieve an end goal.
Likewise, responses to the open-ended questions suggest that informal education activities are not top of mind for many respondents. Despite the increased attention among the scientific community to provide these experiences [Bevan & Smith, 2020], most responses connect experiences with science to a specific utility (e.g., cooking or technology). Again, further suggesting the prominence of functional aspects of science. Responses to the images of science continue to reflect popular media depictions (e.g., scientists in a lab environment), rather than more symbolic images (e.g., a way of understanding the world), or specific entities (e.g., celebrity scientists, government agencies, etc.).
While respondents indicate a consistent way they think and feel about science, how they describe each brand concept remains more nuanced. For example, we only asked about images of science to measure the symbolic construct, but alternatively could ask respondents in what way they feel connected to science (or not). As these data are preliminary, a critical next step is to explore additional qualitative methods to uncover a deeper understanding of how people attach meaning to science. For example, the use of semi-structured interviews and/or focus groups would allow researchers to further build from these preliminary findings. These qualitative methods will enable researchers to then construct reliable and consistent measures for the different brand concepts.
Building from these qualitative findings, validating a survey construct of brand concept management within the context of science that can be embedded into large, nationwide surveys would give more statistical power and insight into how the public thinks and feels about science, and how the BCM framework can connect to and expand on existing frameworks of attitude formation and media effects. For example, do individuals who pay more attention to science and technology news appear more likely to list functional aspects of science compared to those who pay less attention? How does age or level of education relate to the type of experiences mentioned? Finally, are those individuals who are heavy viewers of science fiction or other science entertainment media more likely to recall a certain image of science than those who are light viewers?
These measures will aid in fielding comparative studies to understand the extent to which and in what way global audiences connect to science and why, allowing for comparisons across contexts and time. As of now, there is a lack of “public use” datasets, especially in the U.S., that consistently provide insight to the scientific community on how they are perceived as well as who they are engaging with and how best to do it. Such a resource not only reflects best practices in branding (e.g., constantly measuring how you are perceived and why), but also becomes a long-term resource for practitioners and researchers to develop evidence-based principles for effective engagement. The global scientific community would greatly benefit from uncovering the multidimensional aspects of science that different publics connect to and why, as well as new ways to think about how different emotional connections to science lead to both opportunities and challenges for engaging publics with science.
Acknowledgments
The authors received work support by the National Institute of Food and Agriculture, United States Department of Agriculture, Hatch project WIS03095.
References
-
Besley, J. C. (2018). Audiences for science communication in the United States. Environmental Communication 12 (8), 1005–1022. doi:10.1080/17524032.2018.1457067
-
Bevan, B. & Smith, B. (2020). Science communication in the USA: it’s complicated. In T. Gascoigne, B. Schiele, J. Leach, M. Riedlinger, B. V. Lewenstein, L. Massarani & P. Broks (Eds.), Communicating science: a global perspective (pp. 959–982). doi:10.22459/CS.2020
-
Brakus, J. J., Schmitt, B. H. & Zarantonello, L. (2009). Brand experience: what is it? How is it measured? Does it affect loyalty? Journal of Marketing 73 (3), 52–68. doi:10.1509/jmkg.73.3.052
-
Braun, V. & Clarke, V. (2006). Using thematic analysis in psychology. Qualitative Research in Psychology 3 (2), 77–101. doi:10.1191/1478088706qp063oa
-
Cacioppo, J. T., Berntson, G. G., Larsen, J. T., Poehlmann, K. M. & Ito, T. A. (2000). The psychophysiology of emotion. In M. Lewis & J. M. Haviland-Jones (Eds.), Handbook of emotions (2nd ed., pp. 173–191). New York, NY, U.S.A.: Guilford Press.
-
Cacioppo, J. T. & Petty, R. E. (1989). Effects of message repetition on argument processing, recall, and persuasion. Basic and Applied Social Psychology 10 (1), 3–12. doi:10.1207/s15324834basp1001_2
-
Chang, P.-L. & Chieng, M.-H. (2006). Building consumer brand relationship: a cross-cultural experiential view. Psychology & Marketing 23 (11), 927–959. doi:10.1002/mar.20140
-
Delgado-Ballester, E. & Fernandez Sabiote, E. (2015). Brand experimental value versus brand functional value: which matters more for the brand? European Journal of Marketing 49 (11/12), 1857–1879. doi:10.1108/ejm-02-2014-0129
-
Entradas, M., Bauer, M. W., O’Muircheartaigh, C., Marcinkowski, F., Okamura, A., Pellegrini, G., … Li, Y.-Y. (2020). Public communication by research institutes compared across countries and sciences: building capacity for engagement or competing for visibility? PLoS ONE 15 (7), e0235191. doi:10.1371/journal.pone.0235191
-
Funtowicz, S. O. & Ravetz, J. R. (1991). A new scientific methodology for global environmental issues. In R. Costanza (Ed.), Ecological economics: the science and management of sustainability (pp. 137–152). New York, NY, U.S.A.: Columbia University Press.
-
Hauser, D. J. & Schwarz, N. (2016). Attentive Turkers: MTurk participants perform better on online attention checks than do subject pool participants. Behavior Research Methods 48 (1), 400–407. doi:10.3758/s13428-015-0578-z
-
Huff, C. & Tingley, D. (2015). “Who are these people?” Evaluating the demographic characteristics and political preferences of MTurk survey respondents. Research & Politics 2 (3). doi:10.1177/2053168015604648
-
Johnson, M. K. (2020). Joy: a review of the literature and suggestions for future directions. The Journal of Positive Psychology 15 (1), 5–24. doi:10.1080/17439760.2019.1685581
-
Krause, N. M., Brossard, D., Scheufele, D. A., Xenos, M. A. & Franke, K. (2019). Trends — Americans’ trust in science and scientists. Public Opinion Quarterly 83 (4), 817–836. doi:10.1093/poq/nfz041
-
Lerner, J. S. & Keltner, D. (2001). Fear, anger, and risk. Journal of Personality and Social Psychology 81 (1), 146–159. doi:10.1037/0022-3514.81.1.146
-
McCright, A. M., Dentzman, K., Charters, M. & Dietz, T. (2013). The influence of political ideology on trust in science. Environmental Research Letters 8 (4), 044029. doi:10.1088/1748-9326/8/4/044029
-
Metag, J. & Schäfer, M. S. (2018). Audience segments in environmental and science communication: recent findings and future perspectives. Environmental Communication 12 (8), 995–1004. doi:10.1080/17524032.2018.1521542
-
Nabi, R. L. (1999). A cognitive-functional model for the effects of discrete negative emotions on information processing, attitude change, and recall. Communication Theory 9 (3), 292–320. doi:10.1111/j.1468-2885.1999.tb00172.x
-
Nabi, R. L., Gustafson, A. & Jensen, R. (2018). Framing climate change: exploring the role of emotion in generating advocacy behavior. Science Communication 40 (4), 442–468. doi:10.1177/1075547018776019
-
National Academies of Sciences, Engineering, and Medicine (2017). Communicating science in a complex, competitive communication environment. In Communicating science effectively: a research agenda. doi:10.17226/23674
-
National Science Board (2018). Science and engineering indicators 2018. National Science Foundation. Alexandria, VA, U.S.A. Retrieved from https://www.nsf.gov/statistics/2018/nsb20181/report
-
Newman, B. I. & Newman, T. P. (2018). Brand. Dubuque, IA, U.S.A.: Kendall Hunt Publishing Company.
-
Newman, T. P. (2020). The emergence of science as a political brand. Journal of Political Marketing 19 (1–2), 137–152. doi:10.1080/15377857.2019.1652225
-
Nisbet, M. & Markowitz, E. M. (2014). Understanding public opinion in debates over biomedical research: looking beyond political partisanship to focus on beliefs about science and society. PLoS ONE 9 (2), e88473. doi:10.1371/journal.pone.0088473
-
O’Guinn, T. C., Muñiz, A. M. & Paulson, E. (2019). A sociological critique and reformulation of brands. In F. F. Wherry & I. Woodward (Eds.), The Oxford handbook of consumption (pp. 127–149). doi:10.1093/oxfordhb/9780190695583.013.2
-
Park, C. W., Jaworski, B. J. & MacInnis, D. J. (1986). Strategic brand concept-image management. Journal of Marketing 50 (4), 135–145. doi:10.1177/002224298605000401
-
Payne, A., Frow, P. & Eggert, A. (2017). The customer value proposition: evolution, development, and application in marketing. Journal of the Academy of Marketing Science 45 (4), 467–489. doi:10.1007/s11747-017-0523-z
-
Peer, E., Rothschild, D., Gordon, A., Evernden, Z. & Damer, E. (2022). Data quality of platforms and panels for online behavioral research. Behavior Research Methods 54 (4), 1643–1662. doi:10.3758/s13428-021-01694-3
-
Redlich-Amirav, D., Ansell, L. J., Harrison, M., Norrena, K. L. & Armijo-Olivo, S. (2018). Psychometric properties of Hope Scales: a systematic review. International Journal of Clinical Practice 72 (7), e13213. doi:10.1111/ijcp.13213
-
Reif, A. & Guenther, L. (2021). How representative surveys measure public (dis)trust in science: a systematisation and analysis of survey items and open-ended questions. Journal of Trust Research 11 (2), 94–118. doi:10.1080/21515581.2022.2075373
-
Scheufele, D. A. (2006). Messages and heuristics: how audiences form attitudes about emerging technologies. In J. Turney (Ed.), Engaging science: thoughts, deeds, analysis and action (pp. 20–25). London, U.K.: Wellcome Trust.
-
Scheufele, D. A. (2018). Beyond the choir? The need to understand multiple publics for science. Environmental Communication 12 (8), 1123–1126. doi:10.1080/17524032.2018.1521543
-
ScienceCounts (2015). Unpublished data from Raising Voices for Science: Exploratory and Benchmarking Survey. Survey conducted October 2015.
-
ScienceCounts (2020). Unpublished data from Americans’ Expectations for COVID-19 Vaccine Safety and Effectiveness. Survey conducted December 2020.
-
Snyder, C. R. (1995). Conceptualizing, measuring, and nurturing hope. Journal of Counseling & Development 73 (3), 355–360. doi:10.1002/j.1556-6676.1995.tb01764.x
-
Snyder, C. R., Lopez, S. J., Shorey, H. S., Rand, K. L. & Feldman, D. B. (2003). Hope theory, measurements, and applications to school psychology. School Psychology Quarterly 18 (2), 122–139. doi:10.1521/scpq.18.2.122.21854
-
Southwell, B. G. & White, K. (2022). Science and technology: public perceptions, awareness, and information sources. Science and engineering indicators 2022. NSB-2022-7. National Science Board, National Science Foundation. Alexandria, VA, U.S.A. Retrieved from https://ncses.nsf.gov/pubs/nsb20227
-
Sweeney, J. C. & Soutar, G. N. (2001). Consumer perceived value: the development of a multiple item scale. Journal of Retailing 77 (2), 203–220. doi:10.1016/s0022-4359(01)00041-0
-
Thomas, K. A. & Clifford, S. (2017). Validity and Mechanical Turk: an assessment of exclusion methods and interactive experiments. Computers in Human Behavior 77, 184–197. doi:10.1016/j.chb.2017.08.038
-
U.S. Census Bureau (2020). American Community Survey data profiles. Retrieved May 25, 2022, from https://www.census.gov/acs/www/data/data-tables-and-tools/data-profiles/
-
Urde, M. (2016). The brand core and its management over time. Journal of Product & Brand Management 25 (1), 26–42. doi:10.1108/jpbm-05-2015-0875
-
Volpe, C., Klein, E. & Race, M. (2022). Americans’ motivations for and barriers to engaging with science. Retrieved from https://sciencecounts.org/wp-content/uploads/2022/06/Americans-Motivations-for-and-Barriers-to-Engaging-with-Science.pdf
-
Weingart, P., Joubert, M. & Connoway, K. (2021). Public engagement with science — origins, motives and impact in academic literature and science policy. PLoS ONE 16 (7), e0254201. doi:10.1371/journal.pone.0254201
Authors
Todd P. Newman is an assistant professor in the Department of Life Sciences
Communication at the University of Wisconsin-Madison and an affiliate of the
Robert F. and Jean E. Holtz Center for Science & Technology Studies and the
Nelson Institute for Environmental Studies. His research focuses on the role
of strategic communication within the context of science, technology, and the
environment.
E-mail: tpnewman@wisc.edu.
Becca Beets is a doctoral student in the Department of Life Sciences Communication at
the University of Wisconsin-Madison. Her research explores how different publics view
and engage with controversial science, and the implications for science and risk
communication.
@beetsbecca E-mail: becca.beets@wisc.edu.