

1 Introduction
As of June 2020, social distancing 1 is a crucial practice that still needs to be implemented and sustained around the world to decrease community transmission of COVID-19. Indeed, despite the consensus among scientists and health professionals on the effectiveness of social distancing to decrease community transmission [Courtemanche et al., 2020 ; Greenstone and Nigam, 2020 ; Centers for Disease Control and Prevention, 2020b ], extensive evidence shows that many people around the world, and in the U.S. specifically, are not taking social distancing seriously and “under-responding” to the health crisis [Farber and Johnson, 2020 ]. In particular, as the majority of U.S. states have allowed businesses to reopen in late May 2020 while relaxing the restrictions put in place to limit the spread of COVID-19, the number of new confirmed cases has significantly increased, for example, California and Texas continue to hit their daily records between June 15 to June 30 [Centers for Disease Control and Prevention, 2020a ].
Research from the social sciences can help explain why people do not follow expert recommendations, such as practicing social distancing. A wide range of factors have been shown to impact public perceptions and related behaviors in the context of health and other science related issues — ranging from practical to psychological, political to economic, and cultural to religious [Andersen, 2020 ; Baum, Jacobson and Goold, 2009 ; Huynh, 2020 ; Jaja, Anyanwu and Iwu Jaja, 2020 ; Oosterhoff et al., 2020 ; Saluja, 2020 ; Villa, 2020 ]. These factors are especially relevant for the ongoing COVID-19 outbreak because it is a complex public issue that involves trade-offs between different ideologies, value systems, cultural backgrounds, socioeconomic status, and lifestyles [Krause et al., 2020 ; Scheufele et al., 2020 ]. Scholars in sociology of science have defined this type of complex issue as “wicked problems”, where there is no clear solution and the issues are not tame or benign [Rittel and Webber, 1973 ]. A wicked problem is highly complex because “facts are uncertain, values in dispute, stakes high, and decisions urgent” [Ravetz, 1999 , p. 649]. To address wicked problems, scholars have advocated for the importance of collecting community input to inform policy design and implementation [Dietz, 2013 ; Raisio, 2010 ; Centers for Disease Control and Prevention, 2018 ; Fishkin, 2018 ]. Understanding public attitudes is a necessary step that will help scientists, science communicators, and policymakers recognize how different publics perceive the various risk dimensions of the wicked problem, how they weigh the costs and benefits of the precautionary actions to cope with these risks and ultimately design better public policy responses.
The COVID-19 pandemic is a particularly interesting wicked problem. Although the expert community constantly emphasizes social distancing as one of the most important precautions to protect oneself from the virus [Courtemanche et al., 2020 ; Greenstone and Nigam, 2020 ; Centers for Disease Control and Prevention, 2020b ], little is understood on how the public perceives the barriers and benefits of social distancing in coping with various risks. Moreover, scholars have noted that the public’s perception of risks is dependent on social context and time [Alaszewski, 2005 ; Duff, 2003 ; French, 2005 ]. This highlights the importance of studying public risk perception over time when the public is facing a rapidly changing environment such as the COVID-19 pandemic.
This paper aims to address the important, but less understood, questions about what the American public (specifically, American people in a midwestern state) think when they weigh the benefits of and barriers to performing social distancing to help contain the spread of COVID-19 and how their attitudes evolve over time as cases increased rapidly. To answer these questions, we analyzed open-ended survey responses of over 30,000 Wisconsin residents collected between March 19 and April 1 , 2020, a time when confirmed cases surged and social distancing became necessary. In particular, we examined how public attitudes related to social distancing evolved over this critical time period, when the American state of Wisconsin, like other states in the U.S., started to introduce social distancing policy and state order to curb the damaging consequences of COVID-19. The primary research question for this study is the following: How has the public’s risk perceptions of COVID-19 and attitudes related to social distancing evolved over a critical period in Wisconsin? This paper contributes to our understanding of the nuances of public attitudes related to wicked problems, how these attitudes evolve in a rapidly changing information environment, such as during a pandemic and how this knowledge can inform science communication practice.
2 Context
2.1 COVID-19 as a wicked problem
Wicked problems are inherently complex, as they involve many relevant groups with different priorities, ideal outcomes, and experiences, and require a great deal of purposeful engagement [Brossard, Belluck et al., 2019 ]. Another important aspect of wicked problems is that they do not have a single ‘right’ answer. There are likely to be many possible solutions and strategies that are advocated for by different groups, many of which will likely be in conflict with one another. To be effective, communication around these issues requires an understanding of the attitudes and experiences of different target audiences, as they likely vary widely across groups.
The ongoing COVID-19 outbreak is a great example of wicked problem with many actors and no clear, single solution. As Scheufele et al. [ 2020 ] stressed, it is extremely “difficult to identify the ‘best available science’ for any given policy choice in the middle of an emerging crisis.” Facing an unprecedented global pandemic, health professionals suggest keeping social distancing to reduce health threats before vaccines are available. However, social distancing conflicts with values of civil liberty in the United States and locks down the economy, leading to financial difficulties for many people, especially vulnerable minorities. There is no clear-cut answer about the exact dates to start and end social distancing. Instead, policymakers must make compromises to balance several important factors at once, including health uncertainties, cultural values, and economic difficulties. One crucial way to help address this wicked problem is engaging with lay audiences in a way that can inform policy design and implementation [Brossard, Belluck et al., 2019 ; Dietz, 2013 ; Raisio, 2010 ; Centers for Disease Control and Prevention, 2018 ; Fishkin, 2018 ; Boulianne, Chen and Kahane, 2020 ].
2.2 Putting public at the center of science communication
One of the goals of science communication is to help individuals make informed decisions. To be effective, this communication must be able to navigate complex, evolving media landscapes [Brossard, 2013 ] and political dynamics [Scheufele, 2014 ]. Effective science communication must also provide different publics with the information necessary to “evaluate science policy issues” and aid “the individual’s ability to make rational personal choices” [Nelkin, 1995 , p. 2]. Three models of science communication have dominated the literature over time [see Brossard and Lewenstein, 2009 , for a discussion]: (1) a deficit model (science communicators disseminate scientific knowledge in a one-way, top-down direction to the public) [Trench, 2008 ], (2) a dialogue model (a two-way direction between science communicators and the public where the public is consulted about their perceptions and concerns) [Wynne, 2006 ; Trench, 2008 ], and (3) a participatory model (the science communicators and the public are ideally equal in creating, sharing, and reflecting on science issues) [Bubela et al., 2009 ; Miller, Fahy and the ESConet Team, 2009 ].
Many have stressed the shortcomings of a deficit model approach to science communication [Akin and Scheufele, 2017 ], including in the COVID-19 context [Krause et al., 2020 ]. Indeed, although people are likely to often encounter information from the expert community about what precautionary actions they should take, many still do not follow these suggestions even for a variety of reasons [National Academies of Sciences, Engineering and Medicine, 2016 ]. Some have stressed that a dialogue model for science communication is required under “post-normal science” contexts [e.g., Welp et al., 2006 ], flagging the importance of listening to laypersons to understand their values on the wicked problems and to better inform science policymaking [Brossard and Lewenstein, 2009 ; Jamieson, Kahan and Scheufele, 2017 ]. Furthermore, for communications to be effective, communicators must first understand people’s existing beliefs systems as well as recognize the multiple factors influencing an individual’s processing of and response to information presented to them over time [Dahlstrom, Dudo and Brossard, 2012 ; Rose, Brossard and Scheufele, 2020 ; Scheufele, 2014 ].
2.3 Public’s risk perception of wicked problems
Scholars have highlighted the importance to understand risks in general and health risks in particular as multi-dimensional and embedded in one’s social context [Krause et al., 2020 ]. Indeed, individuals respond to risk information in ways that are dependent to a specific social context [Alaszewski, 2005 ; Duff, 2003 ; French, 2005 ]. Far from being “the ideal” rational actors who base their risk-related decision-making primarily on scientific knowledge, people rely on heuristics, values, and needs when reasoning about and acting on risk information [Alaszewski, 2005 ; French, 2005 ; Kunda, 1990 ].
In fact, even experts are not immune to the influence of social context. For example, factors such as levels of control and responsibility play a powerful role in mediating how health professionals apply scientific evidence to risk management [French, 2005 ]. Risk is a “social rationality” in the sense that it is not only an object of scientific knowledge and a calculation of probability, but also an object of experience and a lived reality of modern societies [Beck, 1992 ; Duff, 2003 ]. As the lived reality and social context change, perceptions of and reactions to risk are also likely to evolve. Indeed, risk characteristics interact with psychological, institutional, social, and cultural processes in forming and transforming risk perceptions, as information about the risk transfers among and is processed by individuals and social groups (e.g., scientists, media, public agencies, advocacy groups) [Kasperson et al., 1988 ]. The risk-as-a-social-rationality proposition suggests that the public’s understanding of risk is at least partly shaped by and evolved with the changing social reality. Furthermore, it dictates a deflection from the expert-oriented risk management approach where communication is concerned with only rendering lay risk perceptions to resemble those of the experts more closely to a model that emphasizes multiple-way communication and pays attention to views of diverse publics. Therefore, theories in risk communication stress that risk by nature is evolving, multifaceted, and requires a deep understanding of public perceptions. It is crucial to investigate how individual’s assessment of risk is intertwined with their living experiences and how these perceptions evolve as the environment that affects people’s living experiences changes.
3 Objective
This paper responds to a persistent call in science and risk communication to use the science of science communication in applied settings [National Academies of Sciences, Engineering and Medicine, 2017 ] by investigating how lay citizens perceive wicked problems and their attitudes towards related behaviors. To understand lay citizens’ perceptions and attitudes, we used innovative computational methods to study large-scale responses people wrote to open-ended survey questions that asked them to reflect upon the barriers and benefits they faced with performing social distancing, and what messages they wanted to hear from experts to persuade them to perform social distancing. To understand the complexity and the changing dynamics of public discourse about the risks and rewards of performing social distancing, we drew from the literature on risk communication to investigate the various risk dimensions of social distancing, including social, psychological, and physical aspects.
This paper contributes to theories in science and risk communication in several manners. First, although understanding public perception has been stressed as a key component for science communication to be effective, empirical evidence on how the public weigh various trade-offs of wicked problems still lacks [Bächtiger, 2018 , p. 660]. It is even less understood what persuasion messages people want to hear from practitioners to change their behaviors on different facets of risky issues. For instance, despite experts’ consensus on the importance and necessity of social distancing, this policy has encountered difficulty in enforcement in the early days of the pandemic. Considering this gap between experts’ suggestions and citizens’ actions, it is crucial to understand how the public navigated the benefits and barriers of a specific risk prevention policy, social distancing. We argue that studying the responses of lay audiences allows us to understand the role of people’s value systems and trade-offs during a pandemic by particularly focusing on those who are reluctant to engage in a desired action [Campbell and Brauer, in press ; Lee and Kotler, 2019 ].
Secondly, this paper contributes to the risk communication literature by showing how people’s risk perceptions and attitudes quickly evolved over time at the earlier phases of the pandemic in the state of Wisconsin in the United States and thus demonstrates the necessity for communication campaigns to respond to this changing dynamic of public opinions. Since the social context people encounter is changing over time, it is important to understand risk perception as a concept dependent on time.
Last but not least, we introduce a state-of-the-art automated text analysis method to demonstrate how machine learning can help researchers analyze large-scale public opinion data to not only identify trends in what the public discussed and how they discussed it, but also how public discussion evolution over time. Unsupervised learning methods do not pre-define any categories, which is crucial when studying wicked problems that researchers and experts do not even know a full scope of the issues on what the public think.
3.1 Context of inquiry
Public risk perception is highly contextual. This paper uses a midwestern state in the U.S. as context of inquiry to demonstrate how public discussion can evolve over a critical period, even within one state. We focus on the U.S. state of Wisconsin, which is a typical agricultural midwestern state known as ‘America’s Dairyland.’ Over 87% of its population is white and over 97% are U.S. citizens [U.S. Census, 2019 ]. Wisconsin is also one of the states that has the highest income gaps, and one of the most racially segregated state in the U.S. [McCann, 2019 ]. Politically, Wisconsin has been known as a swing or battleground state that could be won by either Democrat or Republican presidential candidates [Abramowitz, 2020 ]. Just like other U.S. states, Wisconsin is governed by a state government, and the state is responsible for their own public health. The state governor serves as the chief executive officer who can issue executive orders to state agencies, providing rules and regulations often in response to emergencies.
Wisconsin is a particularly relevant context of inquiry for understanding COVID-19 communication because it exemplifies many of the underlying dynamics that complicate communication at the national and international level. Specifically, Wisconsin represents a lot of the tensions and complexities that have arisen from increasing partisan polarization and urban-rural tensions [Cramer, 2016 ]. These factors are highly relevant for communication surrounding COVID-19, as partisanship and community-type are key experiences that communicators must navigate in order to be successful.
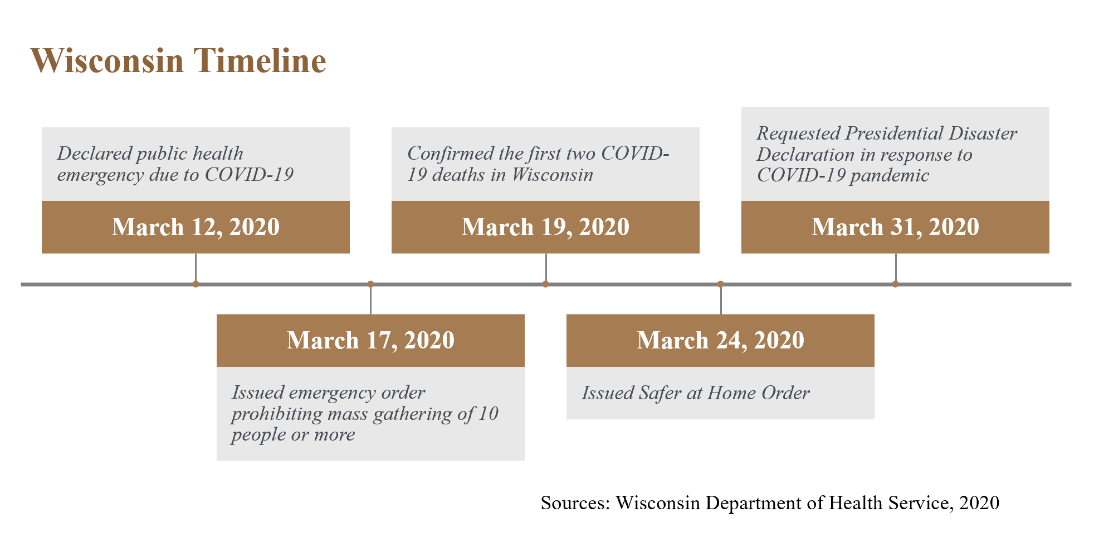
Compared to other states, Wisconsin had relatively fewer reported cases since its first reported case in late February 2020 through June 2020. Figure 1 presents the timeline of major events related to COVID-19 that occurred in Wisconsin from March 12 to April 1 , 2020, the timeline of our study. On March 12, 2020, Wisconsin declared a public health emergency due to COVID-19 as the number of confirmed COVID-19 cases increased to 8. On March 17 , 2020, the Wisconsin Governor issued another emergency order prohibiting mass gathering of 10 people or more. Two days later, he confirmed the first two COVID-19 deaths. As the number of confirmed cases and deaths increased, the Governor issued the Safer-at-Home Executive Order 2 on March 24 . This order required all Wisconsin residents to stay at home as much as possible and non-essential businesses to close temporarily. On March 31 , 2020, the Governor requested a Presidential Disaster Declaration in response to the COVID-19 pandemic, allowing the state to access critical programs and receive federal assistance. In sum, the period of March 19 to April 1 2020 is of great value to examine because of the rapid changes in the COVID-19 cases and the corresponding state actions and order issued and enforced.
4 Methods
4.1 Identification of key dates over the critical time period in Wisconsin
This study aims to compare survey participants’ responses to the three open-ended survey questions between March 19 and April 1 , 2020. Investigating opinion changes might provide explanations for people’s change in social distancing behavior. We used Wisconsin citizens’ real behavior mobility data as well as the date of the Safer-at-Home state order to identify the key dates when our survey participants might have changed attitudes and opinions. The first key date of March 22 , 2020 was chosen based on people’s mobility behavior in Wisconsin.
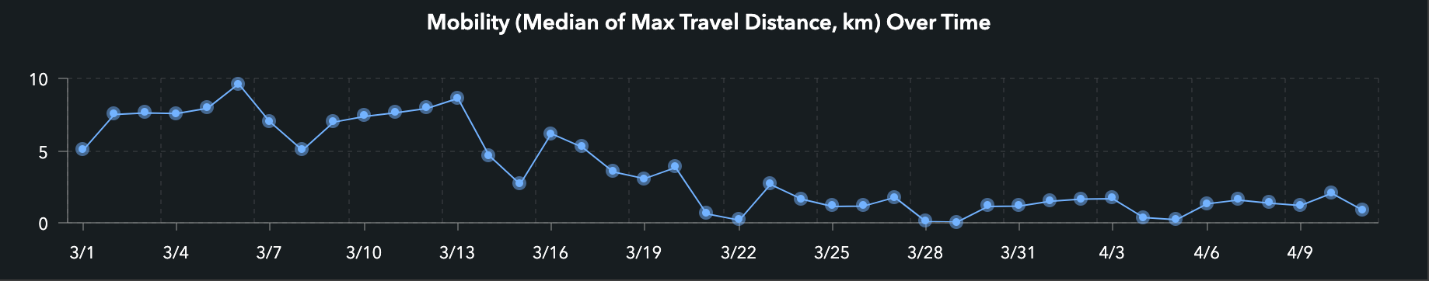
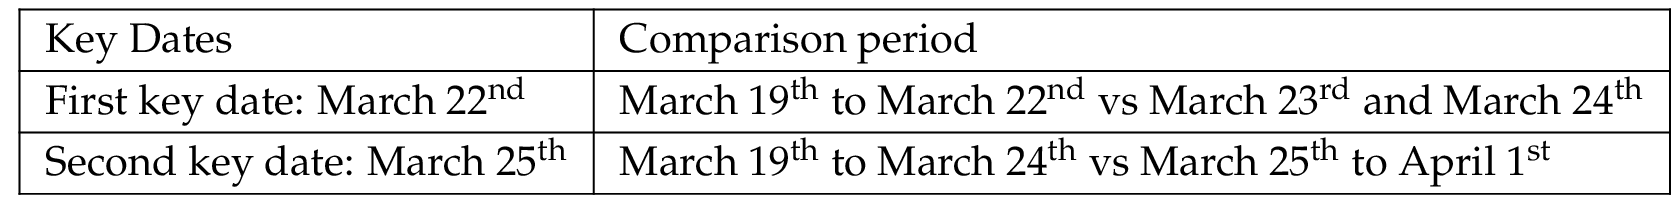
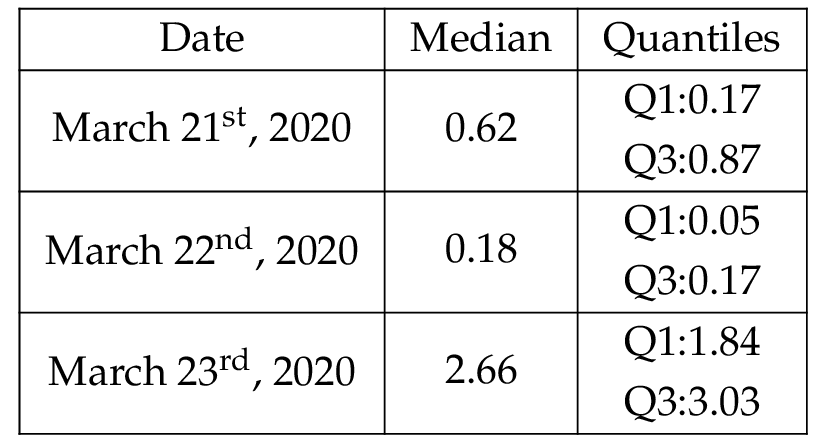
The mobility data was obtained from the GeoDS Lab at the University of Wisconsin-Madison. Researchers in this lab have been collaborating with a third-party organization, SafeGraph, to use aggregated mobile data to track people’s mobility patterns across counties and cities in Wisconsin and across the United States. Figure 2 presents the median of max travel distance (in km) of residents in the Wisconsin state from March 1 to April 9 , 2020. Since our convenience sample study was launched between March 19 and March 24 , 2020, we focused on this time period. We found that there was a drop in residents’ mobility on March 21 and March 22 (near 0km mobility) and an increase from March 23 . 3 For the current study, we therefore used March 22 as a cutoff date considering there was a substantive change in mobility (2km) that happened on that date. Thus, for the first cutoff date, we compared peoples’ answers between from March 19 to March 22 with people’s answers on March 23 and March 24 , 2020.
As a second key date for comparing public discussion content, we chose the date of the Governor issued the Safer-at-Home order, which was March 24 , 2020. We compared peoples’ answers between from March 19 to March 24 with people’s answers between March 25 and April 1 , 2020.
4.2 Timeframe limitation
Before discussing our methods for data collection in detail, we want to acknowledge several limitations on the study timeframe (March 19 to April 1 , 2020). For the first key date (March 22 , 2020), we observed a drop in mobility and chose to compare public perception before and after this date. This drop could be because March 21 and March 22 were weekend days (Saturday and Sunday) and people might move less on weekends compared to weekdays. Ideally, we would have data from a week before and after each of the cut off dates to analyze how responses on weekends compare to those on weekdays. However, we do not have data for that timeframe. We made a necessary tradeoff in precision to better serve the rapid response communication task force at our institution, which was the primary user of the data. Because information was needed urgently to communicate about the outbreak, we used this design to ensure we had timely, high-quality data to provide to those developing and circulating messaging.
4.3 Survey data
Data for the current study came from the “COVID-19 and Social Distancing” survey conducted between March 19 and April 1 , 2020, by an interdisciplinary group of scholars and NGOs ( https://news.wisc.edu/covid-survey/ ). The survey collected self-report data on individuals’ attitudes, beliefs, and behaviors related to social distancing. A link to the online survey was posted on multiple social media platforms between March 19 and March 24 . This snowball sampling resulted in an extremely large number of responses (N = 49,029), indicating that people were eager to help and flagging the urgency to hear public voices. Among those responses, 30,687 were from Wisconsin. A follow up probability-based sample was conducted using a Qualtrics Panel and was fielded from March 25 to April 1 , 2020 (n = 2,251). Among those who completed the second survey, 521 were Wisconsin residents. This paper used both surveys to study how Wisconsin residents changed their perceptions on social distancing from March 19 to April 1 .
4.4 Sample and target participants
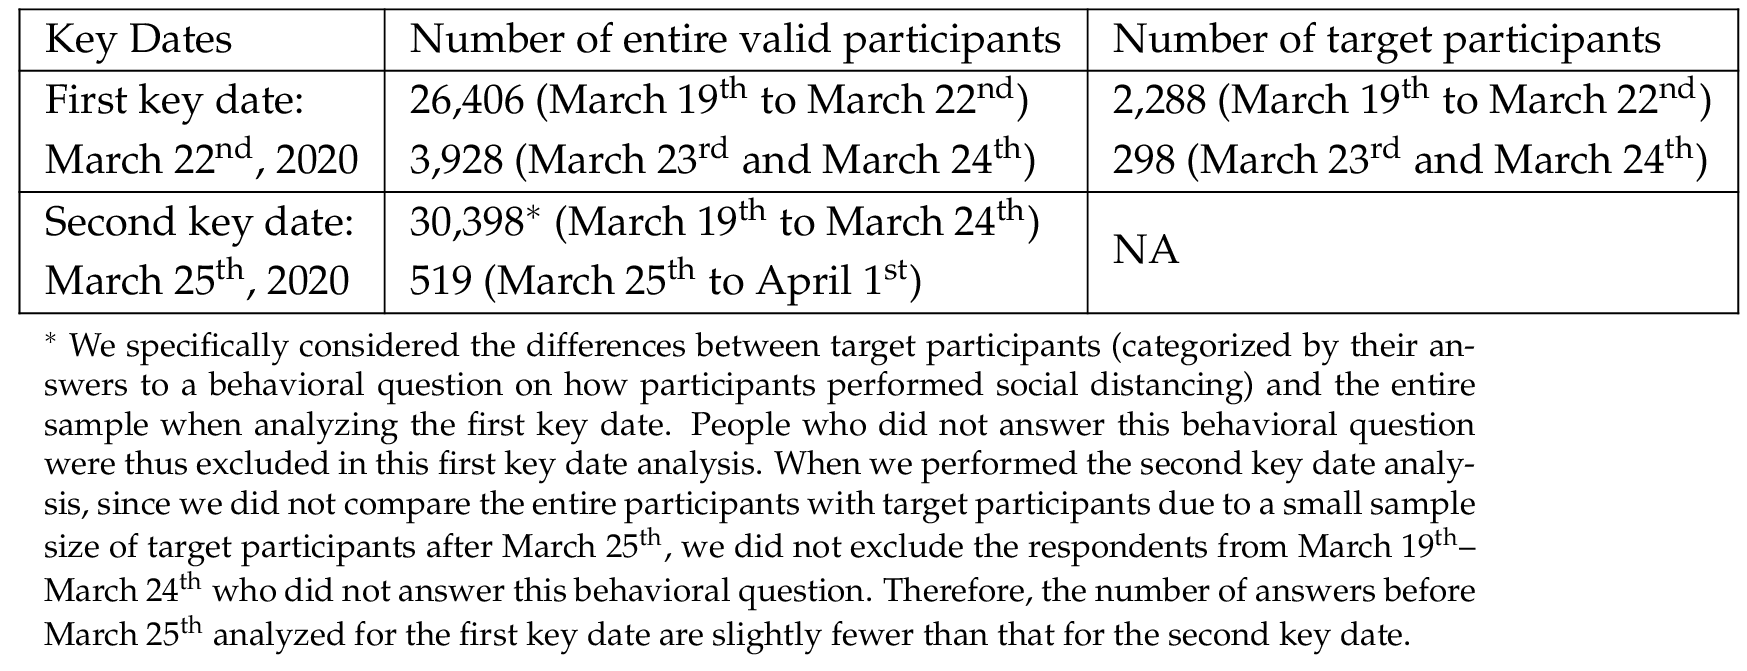
In our analyses, we identified “target participants” primarily based on their responses to the question “Do you currently practice social distancing (in other words: do you deliberately increase the physical space between you and people to avoid spreading illness)?” [1 = “No, not at all” and 5 = “Yes, very much”]. Respondents who selected 1, 2 and 3 to the question (i.e. did not practice social distancing optimally) were labeled as “target participants”. These target participants were compared to the entire participants in subsequent analysis. Table 2 presents the number of entire participants and target participants we analyzed for the two key dates. We did not conduct a comparison for the target participants for period from March 25 to April 1 because there were not enough target participants in this period which influences the interpretability of the structural topic model.
4.5 Survey questions
The survey included questions on media habits, effective messaging, self-reported social distancing behavior, barriers to social distancing, and socio-demographic information. This paper focused on analyzing participants’ responses to three open-ended questions listed below. The first question aimed to know how the public can be persuaded to perform social distancing, which was essential for communication campaigns for some of our partners. The second and the third questions aimed to understand how the public weighs the pros and cons of performing social distancing.
- “What could someone say to you that would make it more likely that you practice more social distancing?”
- “Why is it difficult to practice social distancing?”
- “What benefits would you personally derive if you were to do more social distancing?”
4.6 Analyzing public perception from large-scale open-ended survey questions
Before analysis, we performed a sample balance check, which is described in more detail in the appendix. Then, to analyze how public perceptions, attitudes and opinions related to social distancing evolved over the critical period under study and the responses to the open-ended questions, we used a state-of-the-art automated text analysis method, Structural Topic Model [Roberts, Stewart and Tingley, 2019 ]. Building off traditional topic models such as the latent Dirichlet allocation model (LDA), Roberts and her colleagues [ 2019 ] developed STM as a means for incorporating meta data into topic models. Metadata are independent variables in the model and are not text data. Examples of metadata are gender, race, or time. By studying the relationship between the metadata and the text data, this model allows social scientists to not only study what the public talks about, but also identifying factors affecting what people say.
In this paper, we used two main functions from STM: “stm” and “estimateEffect”. These two functions help us to understand the topic differences around the two key dates of interest. In our STM model, time is the main independent variable. If an answer was written on and before the key date, it was coded as 0 and if an answer was written after the key date, it was coded as 1. Gender and race are control variables. 4 Respondents’ gender was identified as male or female. Respondents who at least partly identified themselves as white/Caucasians were categorized into “white”, while others as “non-white”. The dependent variables are people’s answers to the open-ended survey questions. These covariates allow us to detect how certain meta data influence the discussed frequency of a topic when we examine the topic prevalence.
We chose this automated text analysis methods for two reasons. One is that STM model has been demonstrated to make “analyzing open-ended responses easier, more revealing, and capable of being used to estimate treatment effect” [Roberts, Stewart, Tingley et al., 2014 , p. 1] compared to the traditional method of human ethnographic coding of open-ended survey questions. Secondly, for wicked problems, it is crucially important to not use pre-defined categories by researchers or experts to understand public perception. This unsupervised learning method serves this purpose. We suggested that for wicked problems, it is not only important to hear what the lay citizens think, but also important to choose analysis methods that have few pre-assumptions as possible. Even though researchers in manual content analysis read a sample of citizens’ opinions to develop categories, these categories could be biased by existing predispositions from researchers and are limited when the data scale is large. 5
To reduce the risk of Type I error caused by our large sample size, we set our alpha level to 0.01 and concentrated our interpretations on findings that met this threshold.
5 Results
5.1 How public perception on “persuasive messages” to perform social distancing evolved
We found that for all participants, as well as our target participants (i.e., those who have not performed social distancing well), there was a small shift in the content that could persuade them to perform more social distancing over the critical time period of March 19 to April 1 , 2020. In the early days when social distancing was just introduced to people (March 19 to March 24 , 2020), changes in public opinion regarding persuasive messages are small and are not significant at the 0.01 level. We observed a larger change in public discussion after the State enacted the Safer-at-Home order on March 24 , 2020. Participants began to point out that messages about the infection rate such as how COVID-19 is impacting different communities in Wisconsin would be more persuasive.
5.2 Small changes in participants’ opinions around March 22 on persuasive messages
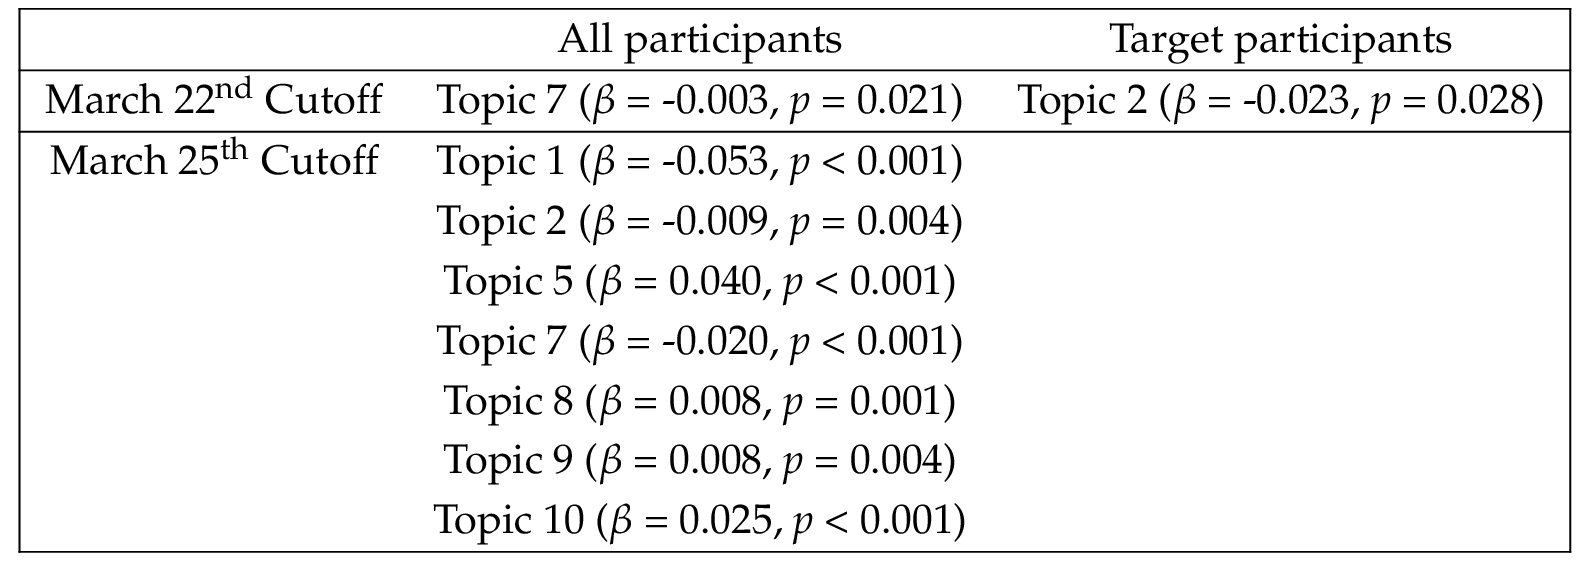
Table 6 (row March 22 cutoff) 6 presents how the time variable (i.e. March 19 –March 22 vs March 23 –March 24 , 2020) influences the prevalence of topics, which summarizes participants’ answers to the persuasion question.
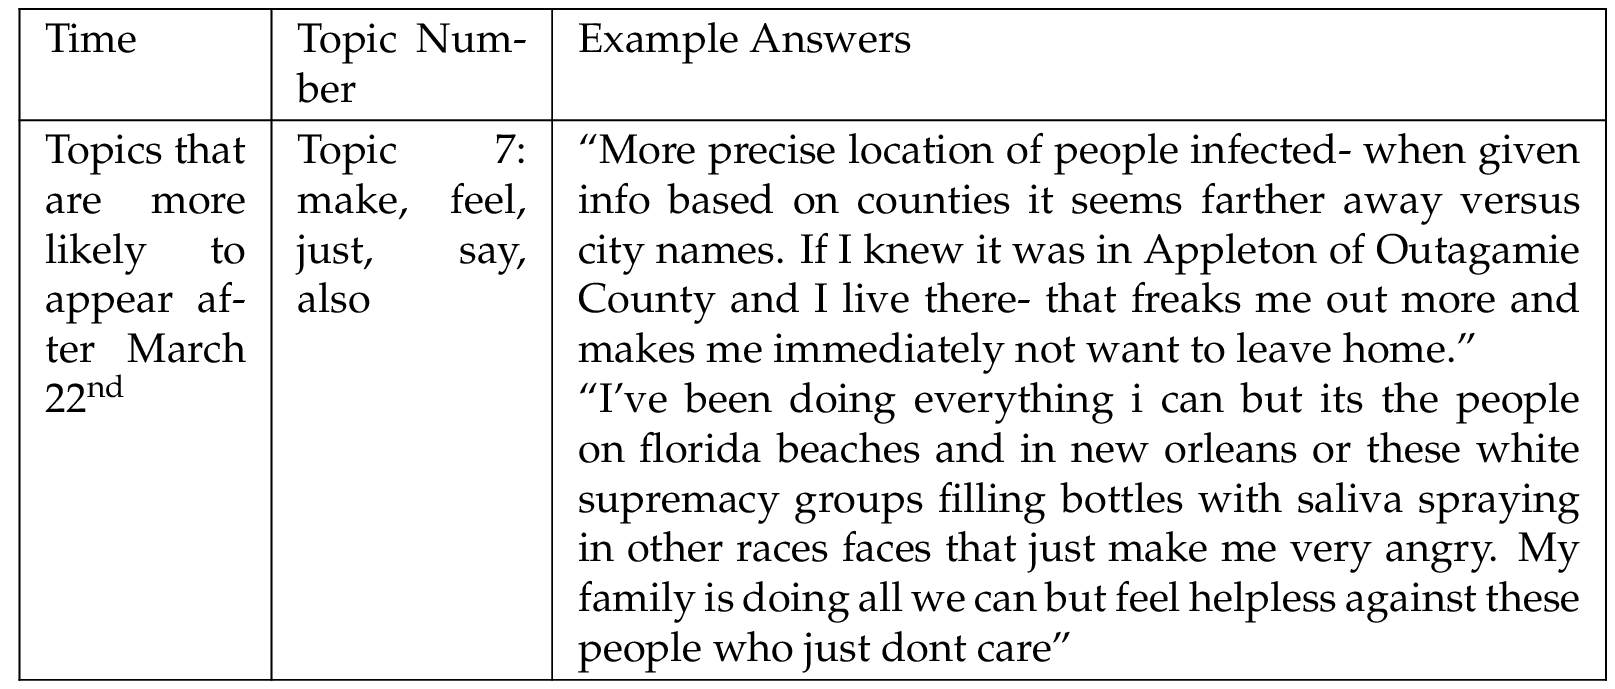
We found that topic 7 was more likely to be raised after March 22 , 2020. Keywords and responses that are highly associated with topic 7 are examined for an understanding of the content. Based on an analysis of the sample answers listed in Table 7 , we found that topic 7 is related to participants’ discussion of their affective feelings (e.g., “freak out”). Participants also requested that more information related to personal relevancy need to be provided in order to be persuaded to perform social distancing. It is worth noticing that the effect size for this topic is small (0.3%) and the p-value is 0.02, which is not significant at the 0.01 level. Regarding our target participants that reported little social distancing practice, their opinions about persuasive messages around March 22 did not significantly change, similar to the other participants.
5.3 More salient changes in participants’ opinions around March 25 : from everyday essentials (i.e., living experiences) to health-related persuasion
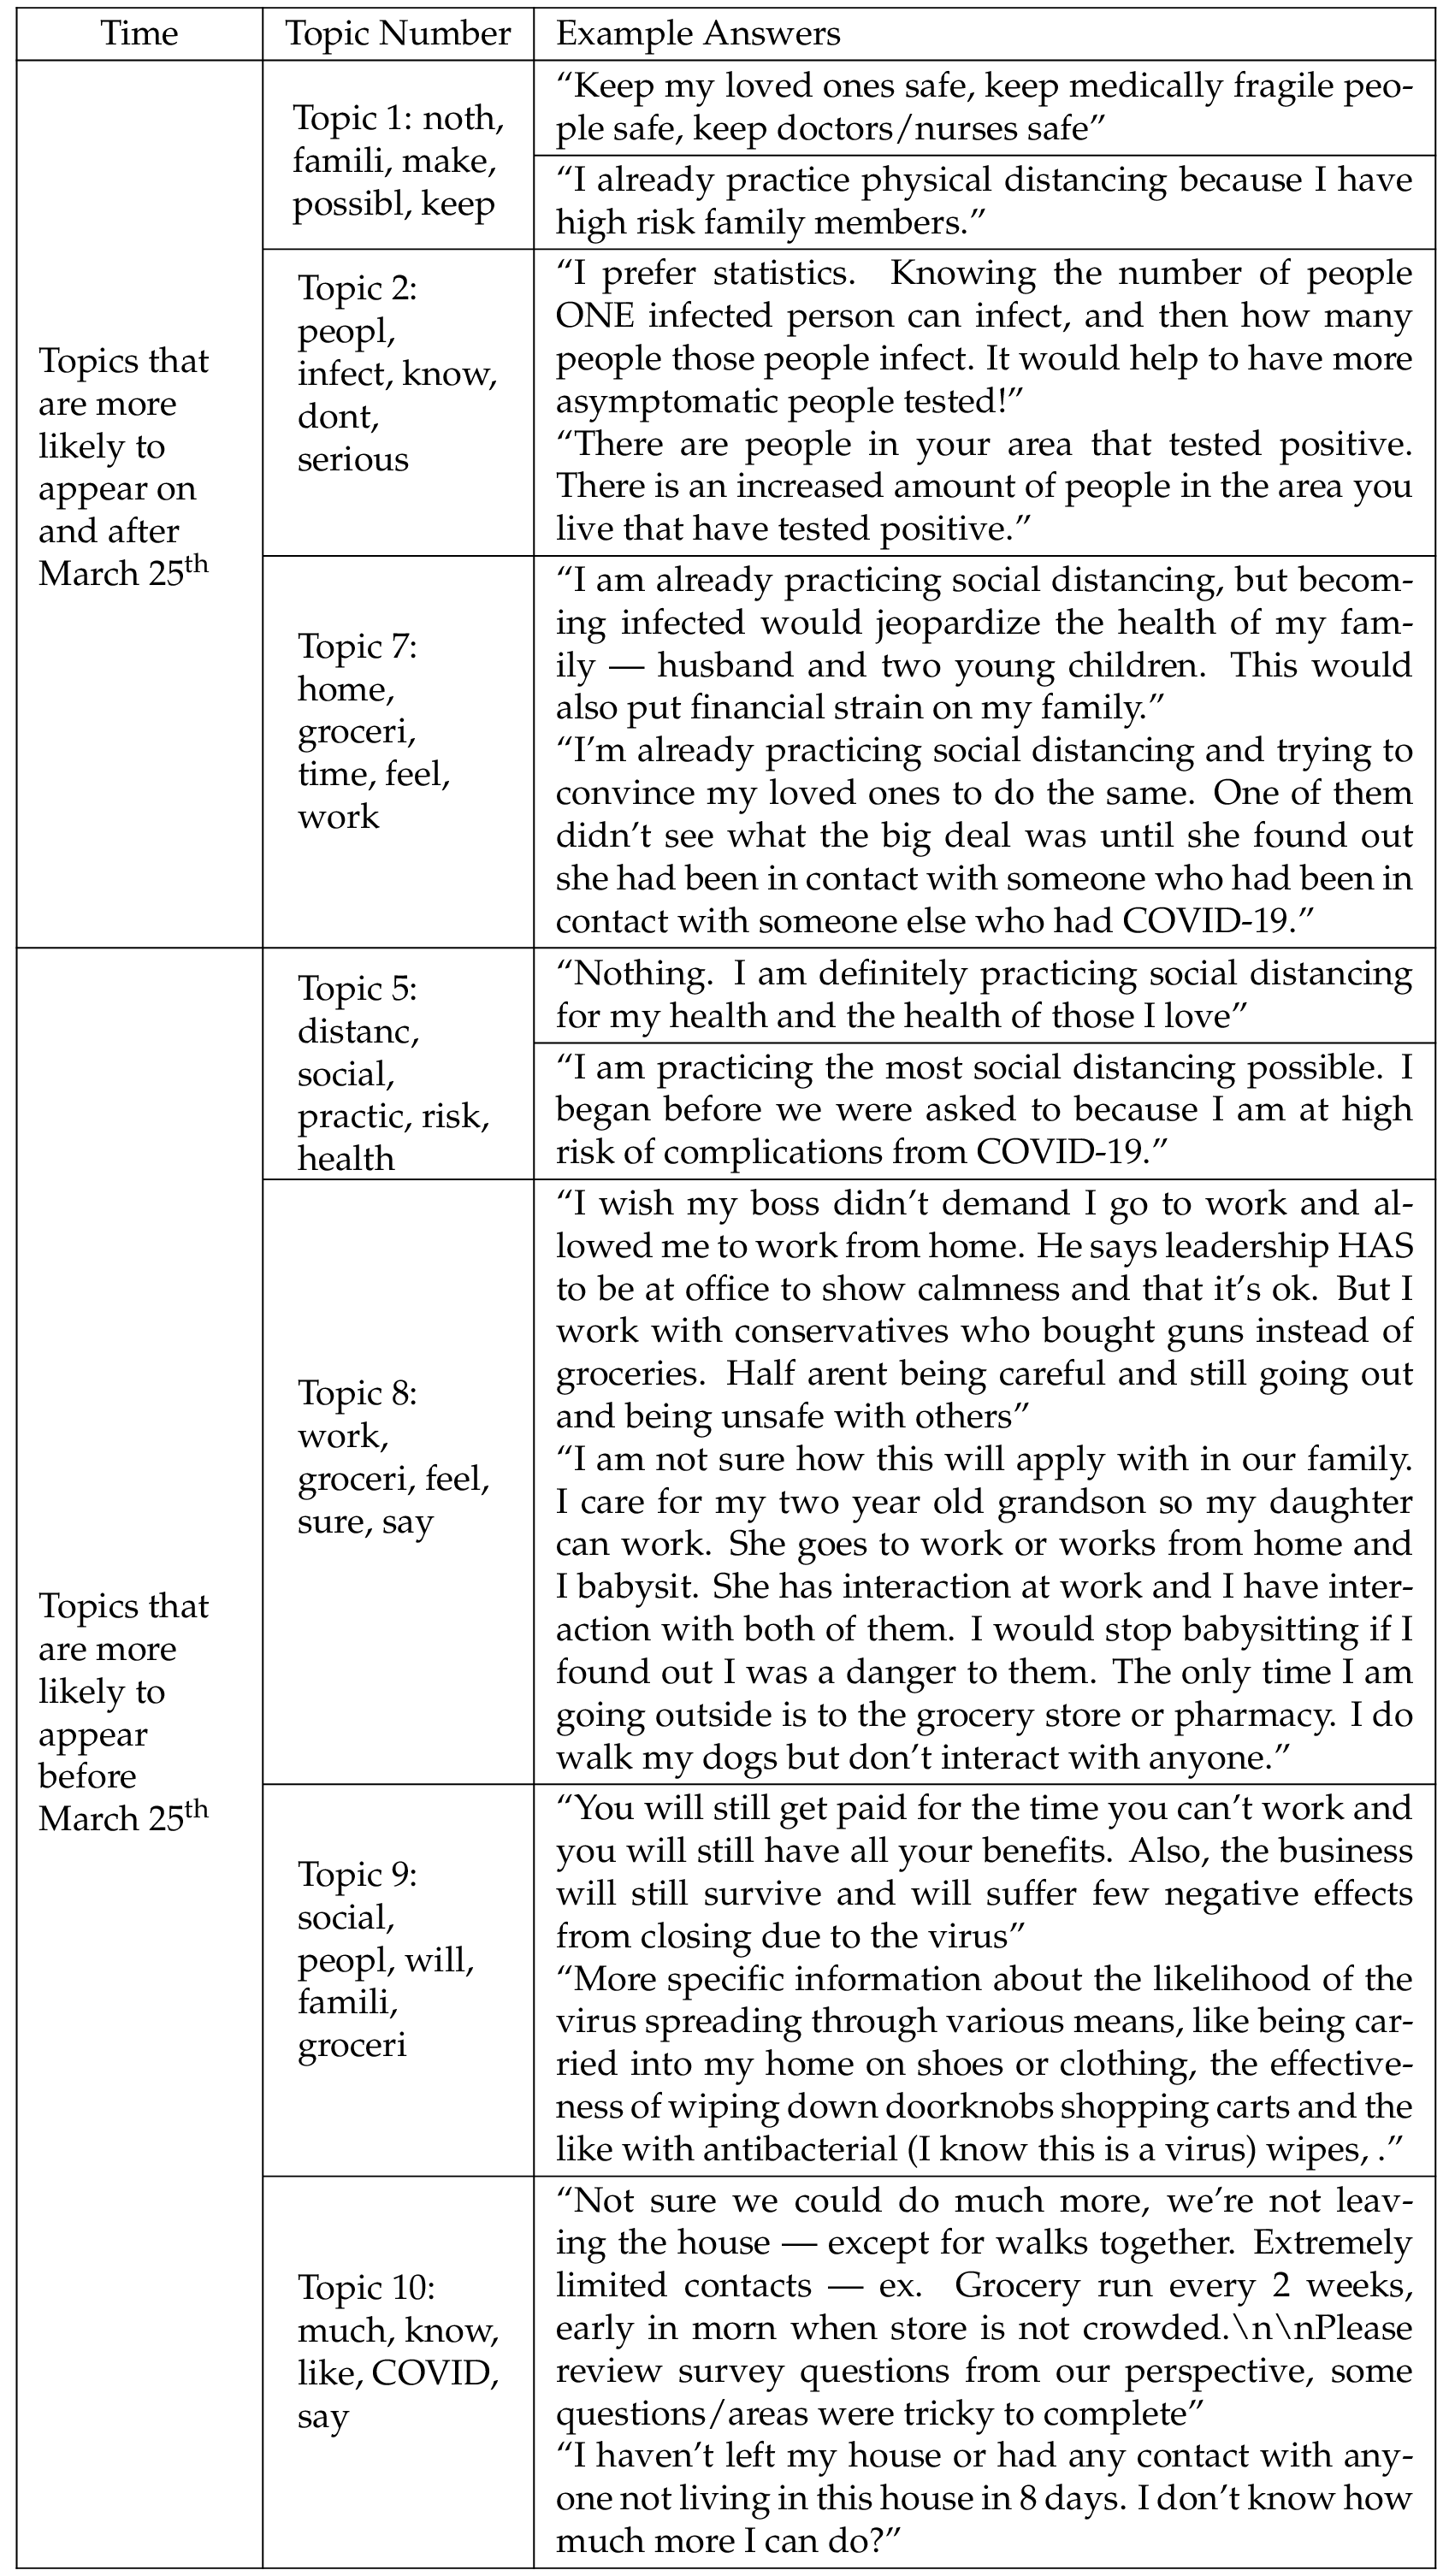
Unlike the small changes in public opinion around March 22 , 2020, we observed relatively larger changes in what the public wanted to hear around the March 25 cutoff when the state enacted the Safer-at-Home order. Table 6 (row March 25 cutoff) shows how all of our participants changed their answers to the persuasive question around March 25 . For instance, topic 1 is 5% more likely to be raised after March 25 and topic 5 is 4% more likely to be raised before March 25 (both topics are significant at the 0.01 level).
Table 9 lists the keywords associated with these topics, and the example responses participants wrote. Prevalent topics before March 25 are more likely associated with a warrant for living experiences issues related to everyday essentials. Topic 5 pointed out that some participants already practiced social distancing a lot. Topic 8 included discussions about everyday essentials such as their jobs, daily grocery supplies, and families. This suggests that participants were worried about the multi-layered challenges when the launch date of state’s Safer-at-Home order (March 25 , 2020) approached. As a result, participants requested persuasive messages to attend to not only their health but also their living experiences. Likewise, topics more prevalent on and after March 25 , 2020 showed that participants demanded persuasive messages to provide more information about the infected statistics (topic 2).
5.4 How public perception on “barriers” to perform social distancing evolved
All participants, including our target participants, raised different types of barriers for performing social distancing over the critical time period from March 19 to April 1 , 2020. The most prominent difference regarding barriers over time was that participants highlighted emotional/psychological difficulties associated with the absence of socialization after social distancing was introduced for several days (March 23 –March 24 , 2020). When social distancing was just introduced (March 19 –March 22 , 2020), participants focused more on barriers related to their obligations as a social and family member (e.g., essential workers). These practical daily life barriers also became more salient after the state enacted the Safer-at-Home order (March 25 to April 1 , 2020).
5.5 Comparing participants’ opinions around March 22 : from basic living needs to emotional barriers
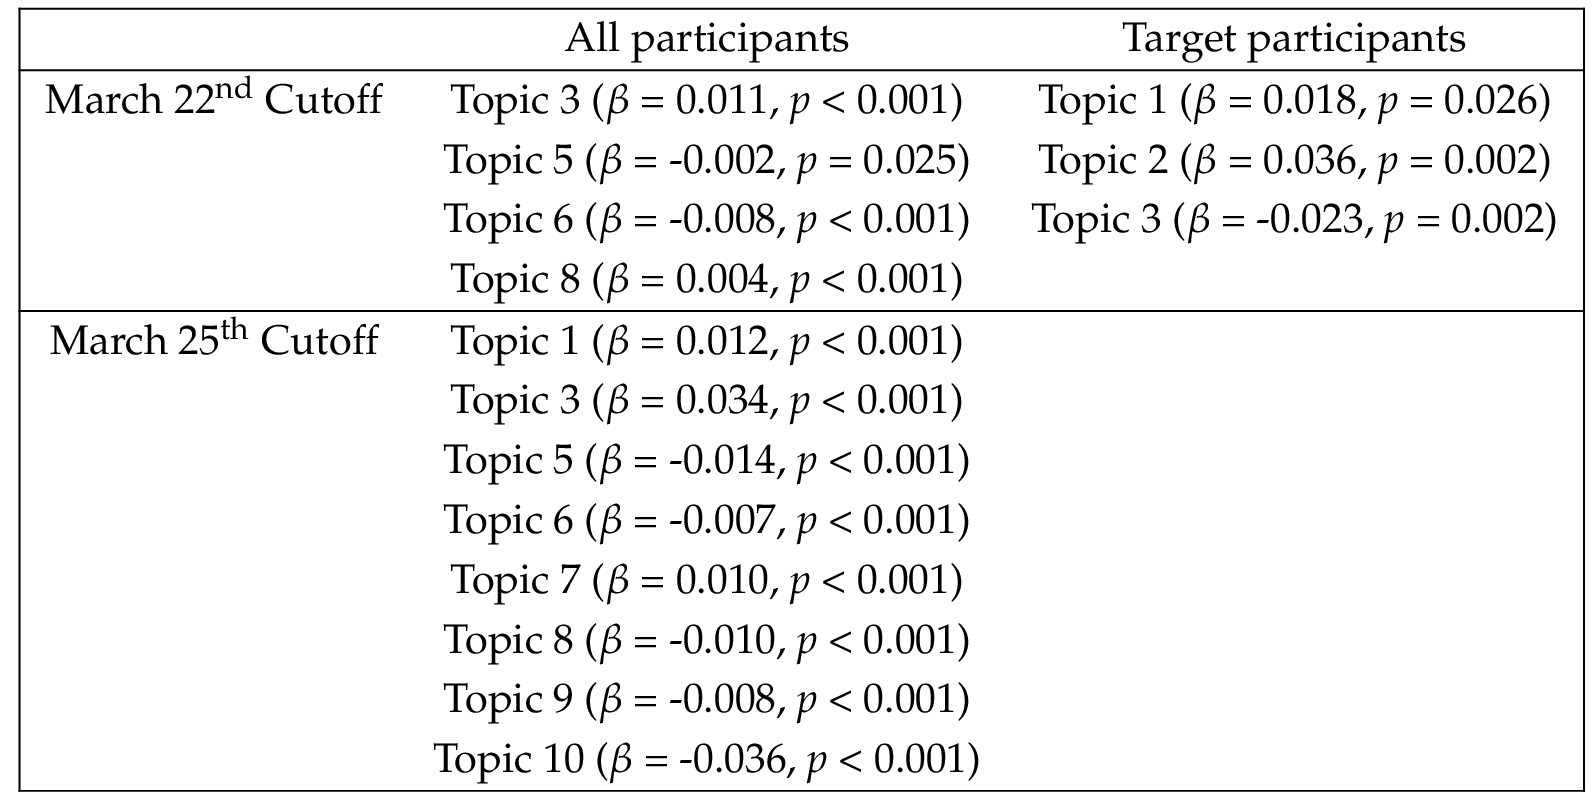
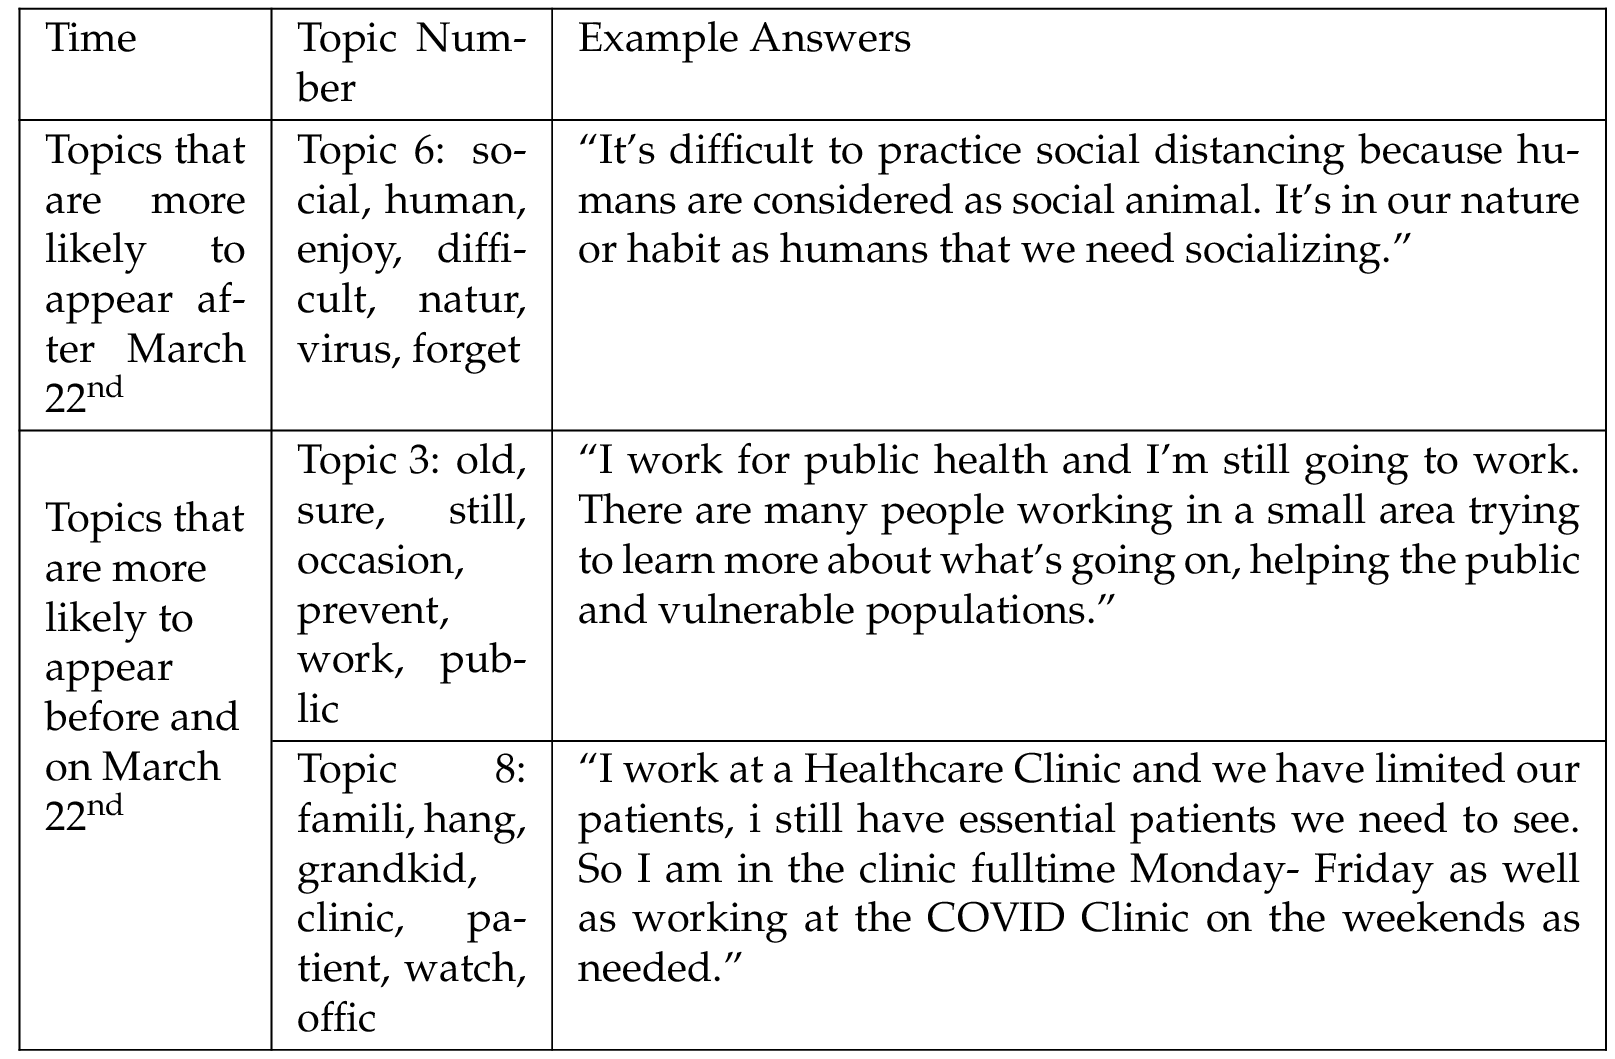
Table 10 (row March 22 cutoff) shows the effect of time on topic prevalence for our 10 labeled topics regarding how Wisconsin participants discussed the barrier question. While working in essential industries, such as healthcare (topics 3 and 8) is more likely to be raised by participants before and on March 22 , 2020, topic 6 (socialization as human nature) is more frequently discussed among participant after March 22 , 2020. According to the keywords and examples of these topics (Table 11 ), we found that when thinking about what the barriers were for practicing social distancing, participants’ opinions shifted from focusing on one’s obligations as a social and family member when social distancing was just introduced to one’s emotions and needs after they practiced social distancing for several days.
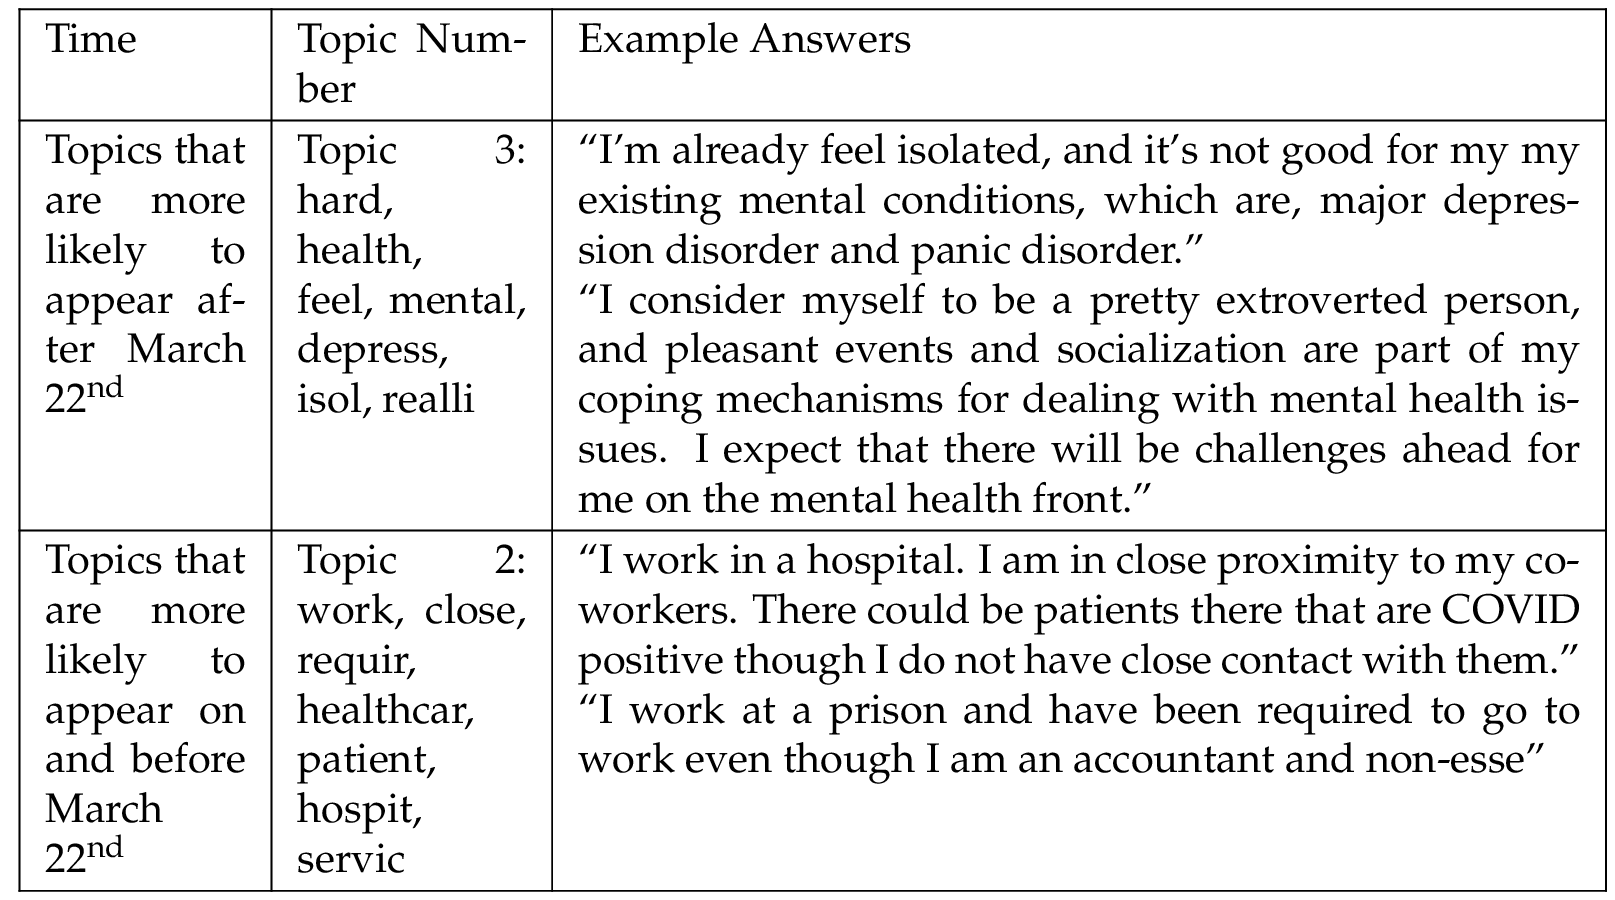
Though we observed similar changes in perceived barriers between all participants and target participants in our survey, the effect size of changes was more pronounced among target participants around March 22 , 2020. Topic 3 (mental health) is 2% more likely to be raised after March 22 , 2020. For instance, some respondents felt isolated and depressed about staying at home; some pointed out that socializing is a necessity of current lifestyles (Table 12 ). On the contrary, topic 2 (the inability to work at home) is 4% more prevalent before and on March 22 , 2020. These changes are all significant at the 0.01 level. Interestingly, we see that our respondents’ discussion of barriers moved up the hierarchy ladder, from basic living needs to the self-fulfillment and psychological needs.
5.6 Comparing participants’ opinions around March 25 : continuous multi-level challenges
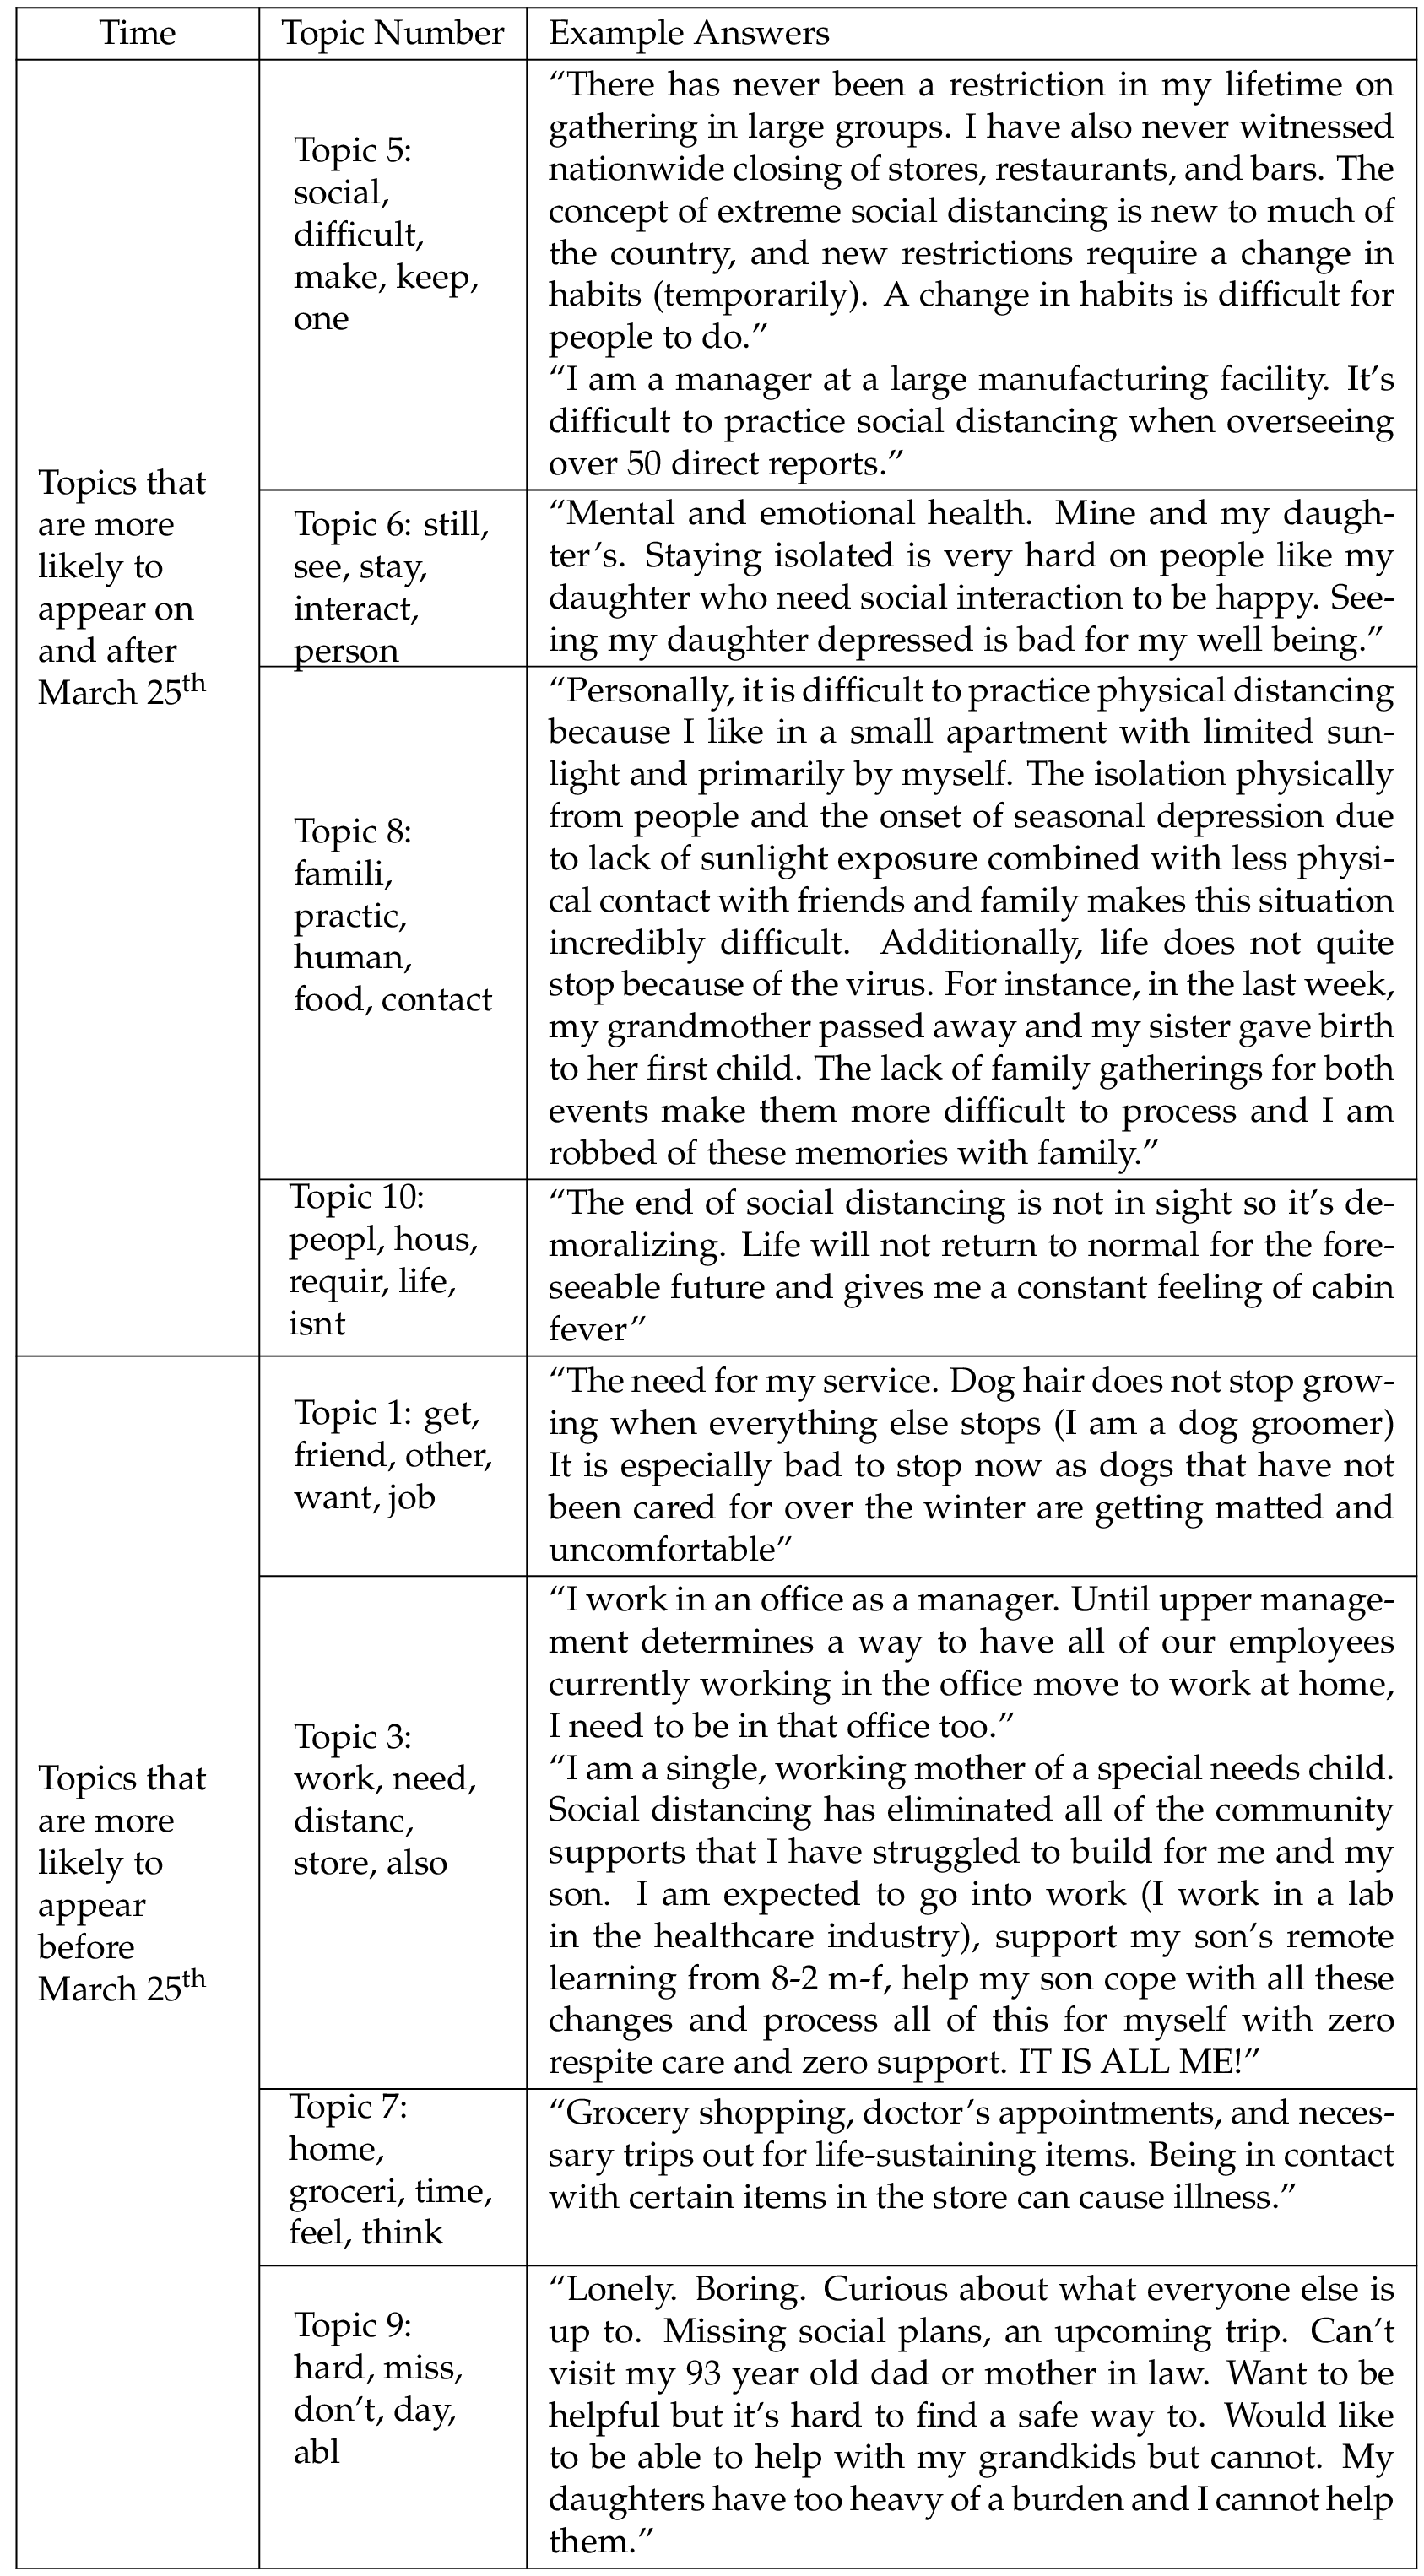
Table 10 (row March 25 cutoff) presents opinion changes from Wisconsin participants around March 24 . All changes are significant at the 0.01 level. Before the state issued the Safe-at-Home policy on March 25 , worries about social distancing’s disruption to their work (topic 3) are 3% more likely to be discussed. Besides, other frequently mentioned barriers before March 25 include doing home essentials (topic 1 and topic 7) and psychological barriers (topic 9). Topics more prevalent after March 25 , 2020 also addressed difficulties to change work and lifestyles (topics 5 and 8) and their need to interact with other people (topics 6 and 10). These findings demonstrate the continuous multi-level barriers participants faced with before and after March 25 , 2020.
5.7 How public perception of “benefits” to perform social distancing evolved
We found that all Wisconsin participants, including our target participants, pointed out different types of benefits of performing social distancing over the critical time period from March 19 to April 1 , 2020. In the early days when social distancing was just introduced (March 19 to March 22 , 2020), participants were mentioning public health benefits such as lowering the chance of infection. On March 23 to March 24 , 2020, people started to realize more personal improvement benefits. For instance, participants mentioned that staying at home allowed them to do things they never had a chance to do before the pandemic. After the state enacted the Safer-at-Home order (March 25 , 2020), participants started to point out more about how social distancing can benefit not only themselves but also their families and the community.
5.8 Small changes in participants’ opinions around March 22 on benefits
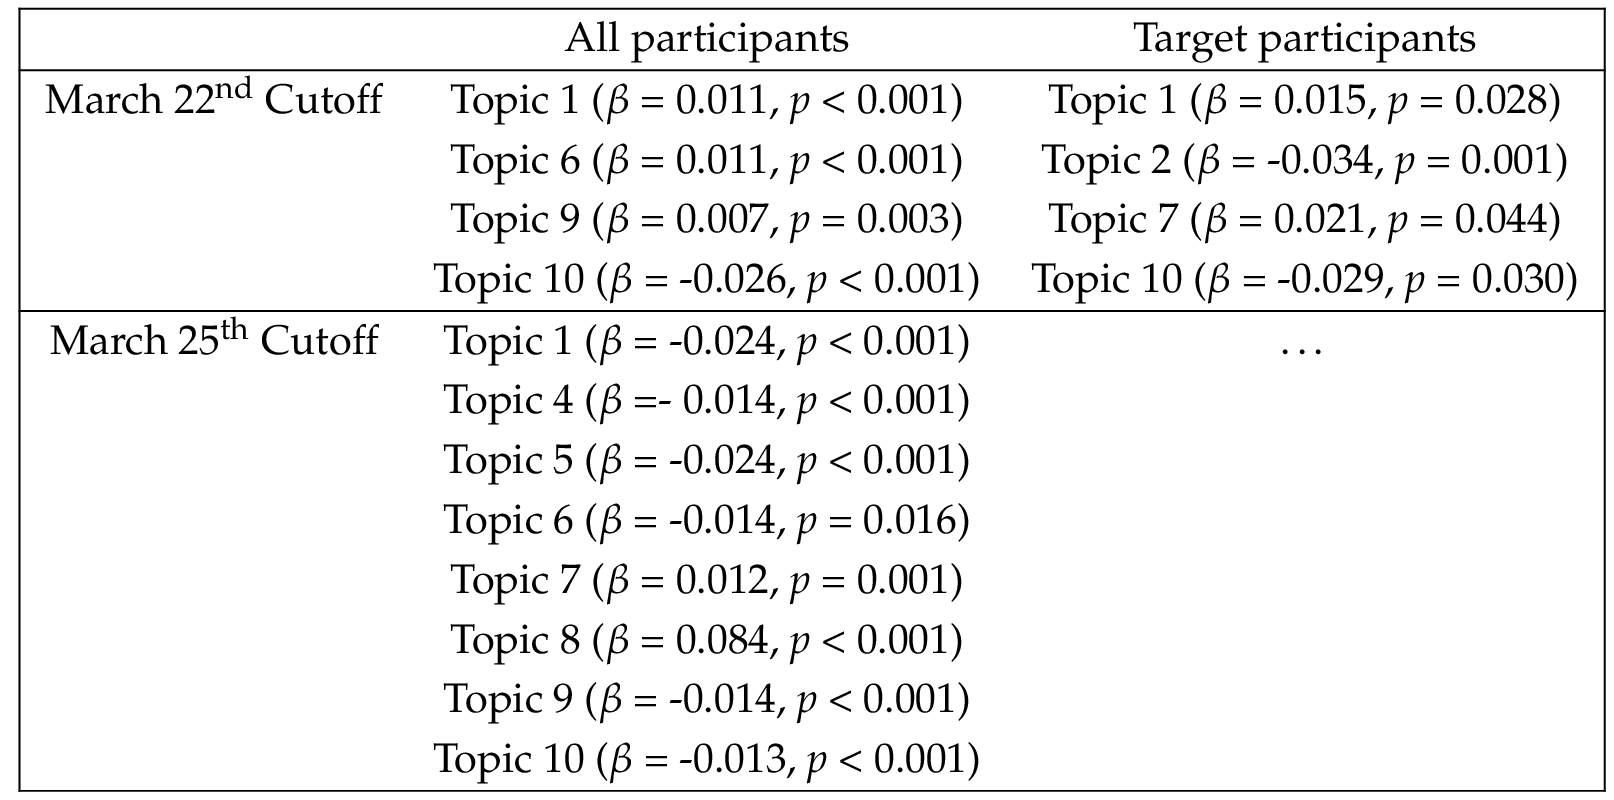
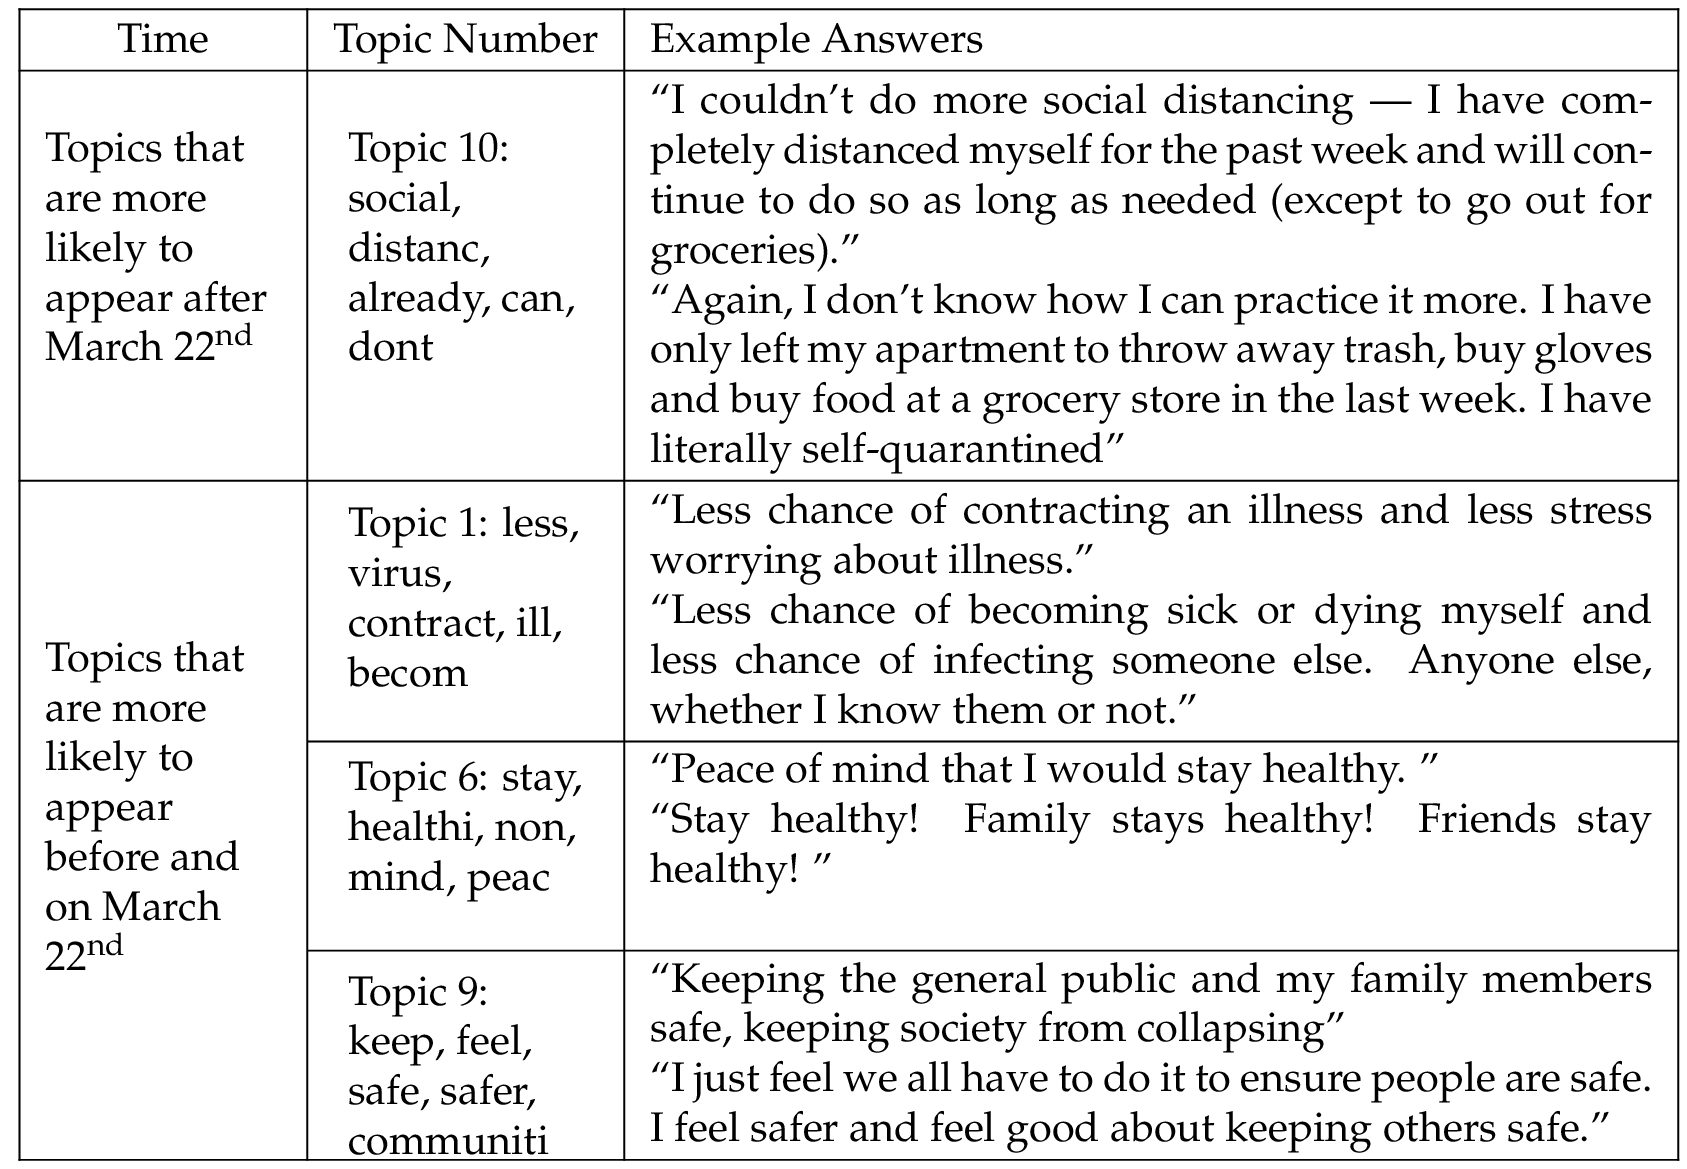
Table 14 (row March 22 cutoff) shows how answers on benefits of practicing social distancing shifted among all our Wisconsin participants. Topic 1, 6, and 9 are more likely to be raised on and before March 22 , 2020 and topic 10 is more likely to be raised after March 22 , 2020. Although the shift in topics is statistically significant at the 0.01 level, the effect size of each topic is small (1%-2%). Before March 22 , 2020, participants noted health benefits for themselves and the public. For instance, topic 1 discusses the benefit of (personal) health that social distancing could prevent people from being exposed to the virus. Topic 6 refers to people’s discussion on their inner peace of mind from staying healthy thanks to social distancing. Also, the health condition of others or community health was a more frequently discussed benefit on and before March 22 , 2020 (topic 9). Topic 10, more prevalent after March 22 , 2020, suggests that participants were not identifying specific benefits of social distancing but emphasized that they were already practicing it.
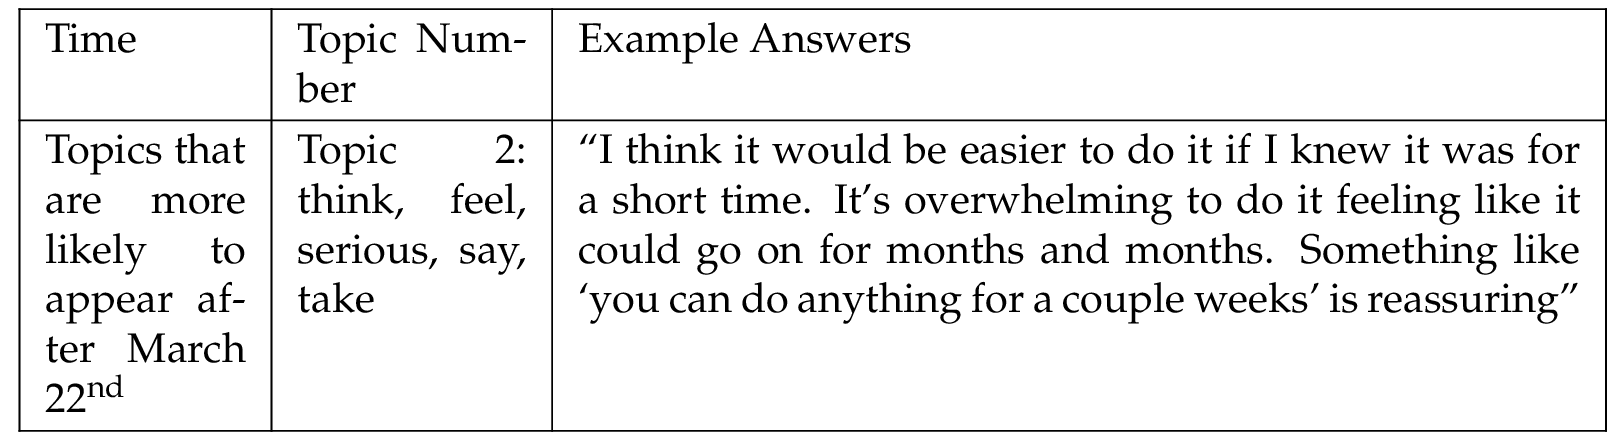
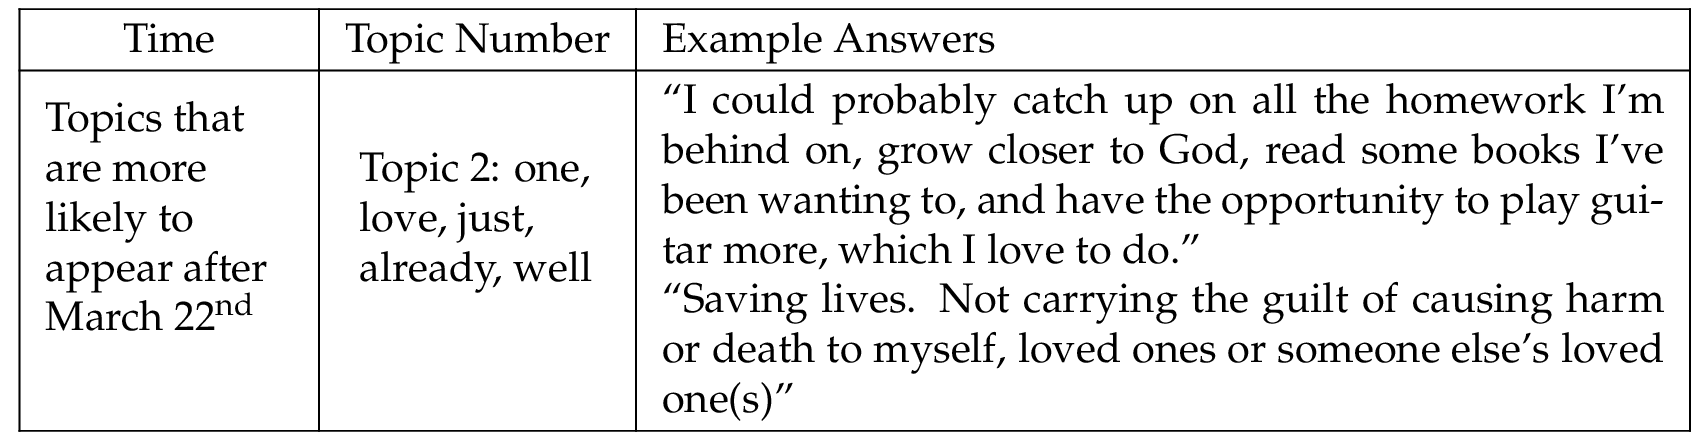
Examining the change of target participants on perceived benefits of social distancing around March 22 , 2020, the only significant shift in topic content at the 0.01 level was topic 2. After March 22 , 2020, target participants are more likely to mention benefits of protecting themselves and their loved ones and practicing hobbies at home that they do not have time to do before. Compared to other participants who reported higher degrees of social distancing, target participants showed a delay of recognizing health-related benefits for themselves and loved ones.
5.9 More changes in participants’ opinions around March 25 : from better allocation of personal time at home to family and community benefits
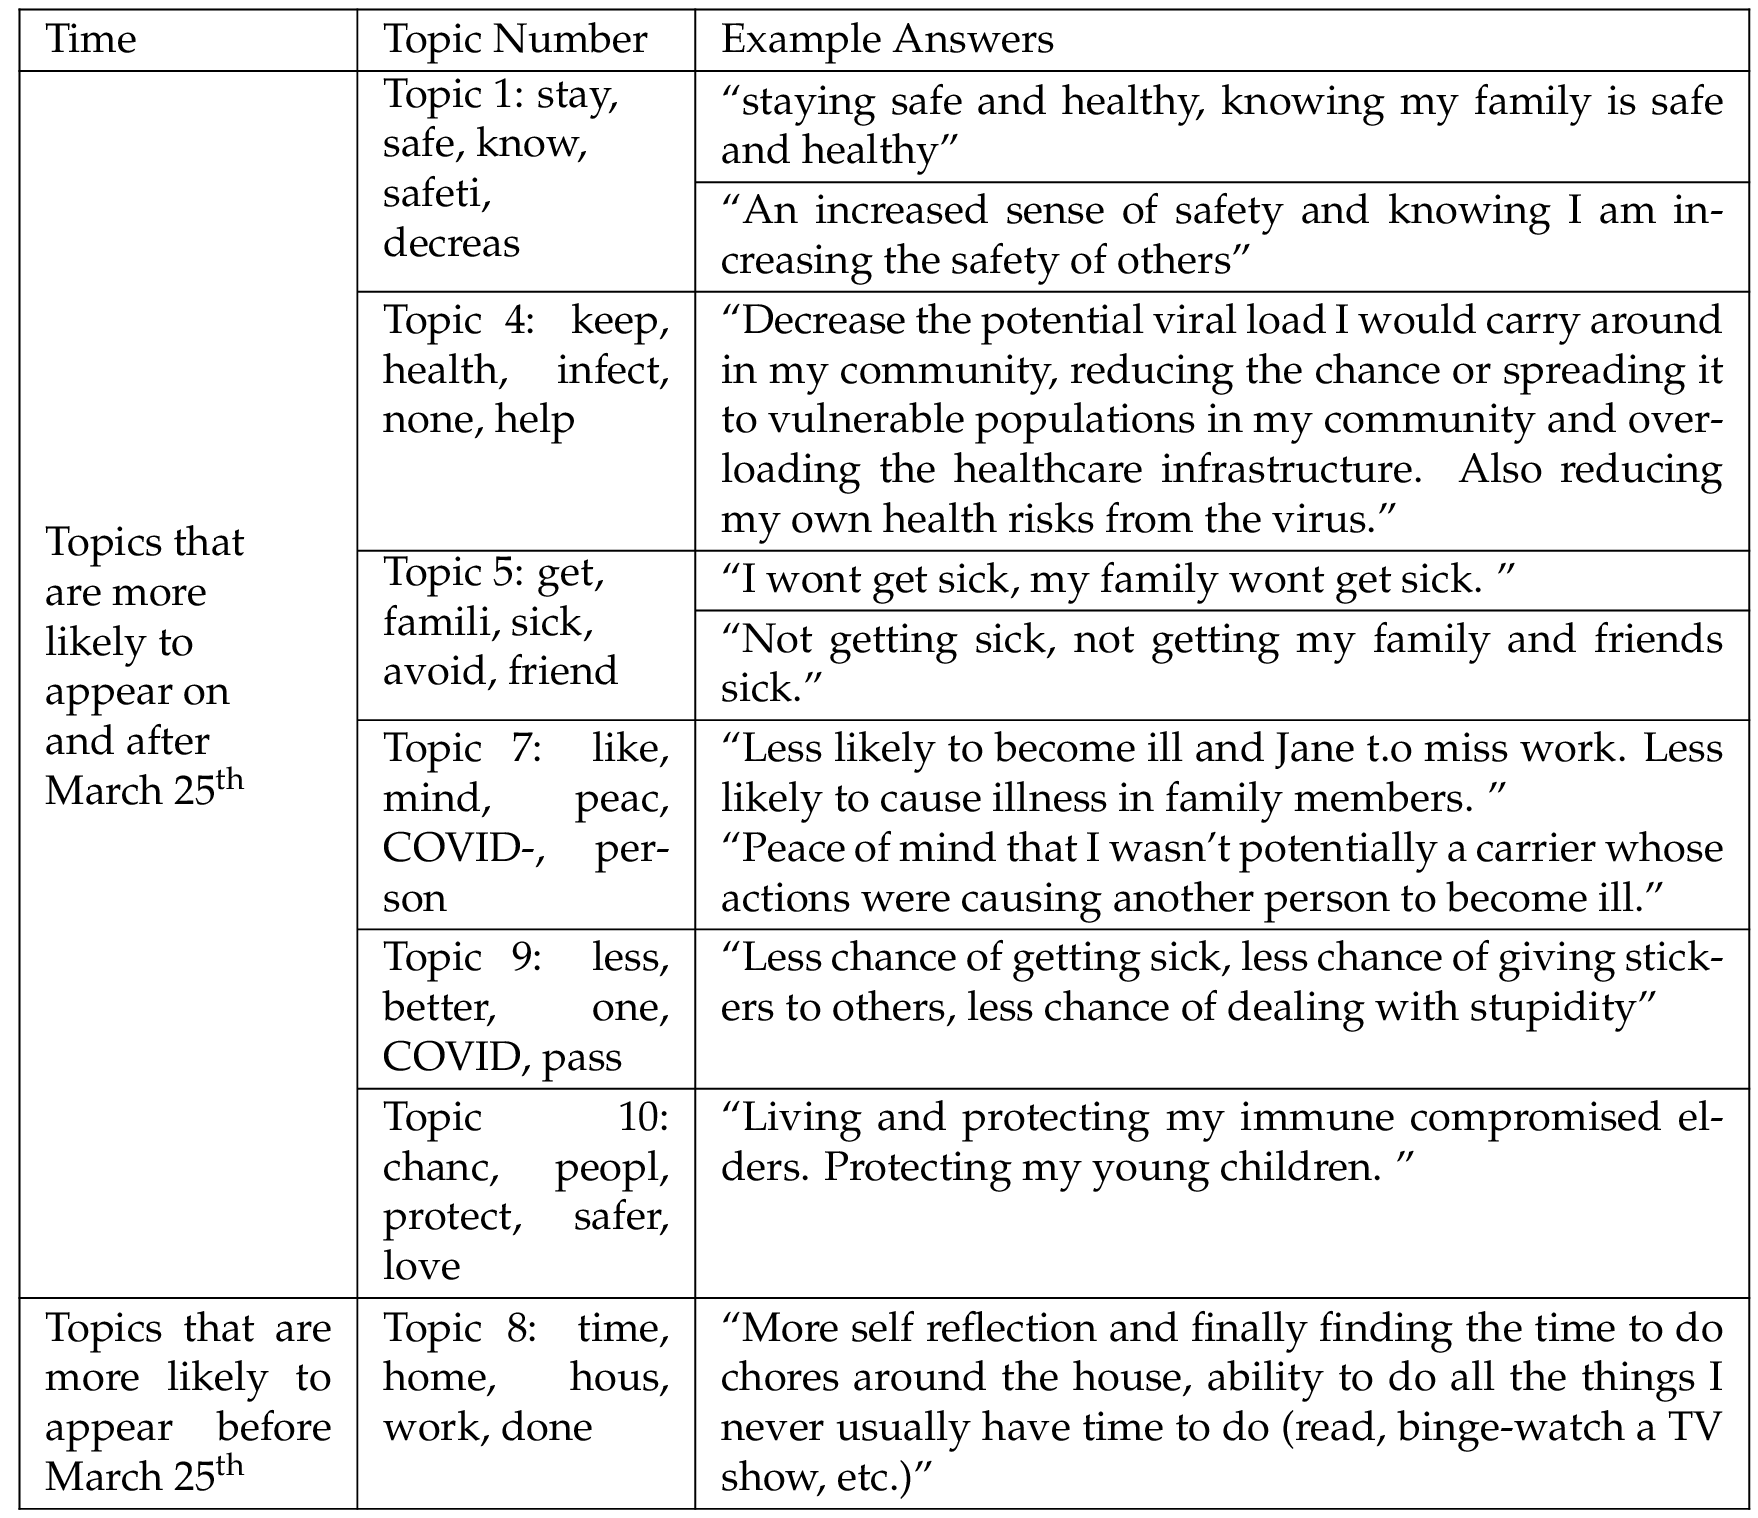
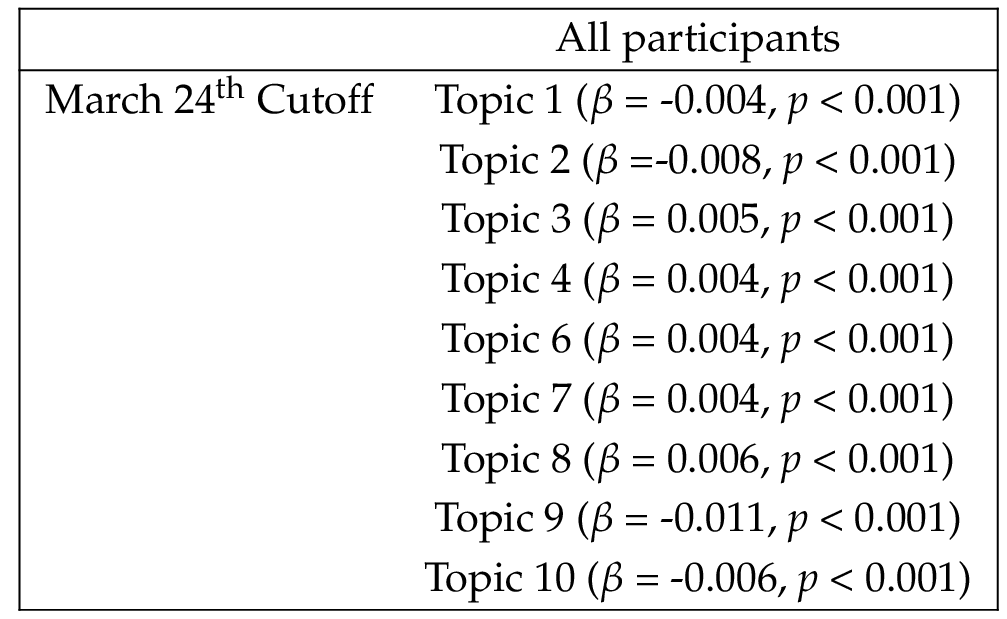
Table 14 (row March 25 cutoff) shows the effect of time on topic prevalence regarding all our participants’ answers to the benefits question. Topics 1, 4, 5, 7, 9, and 10 are more prevalent on and after March 25 , and topic 8 is more likely to be raised by participants before March 25 , 2020. These changes are all statistically significant at the 0.01 level. Table 17 lists the keywords associated with these topics and example responses. A substantial (8%) prevalence of topic 8 before March 25 , 2020 is especially noteworthy. Topic 8 is about respondents’ taking advantage of staying at home to get things done. For instance, they had more spare time to do time-consuming housework that they could not do before the pandemic. After March 25 , 2020, respondents pointed out benefits including physical health benefits such as decreasing virus infection in order to avoid negative impacts on work and to protect families, friends, and communities (topic 1, 4, 5, 7, and 9) , and their feeling of peace in mind from protected physical health (topic 6).
6 Discussion and implication
6.1 Implications for risk and science communication theories
This paper used automated text analysis method to investigate 30,000 open-ended responses among Wisconsin residents regarding what they perceived as effective persuasion, barriers, and benefits for practicing social distancing. We focused on the evolvement of attitude change on two important dates between March 19 to April 1 , 2020. One is the significant decline of mobility among citizens (March 22 , 2020) and the other is the announcement of Safer-at-Home order (March 24 , 2020).
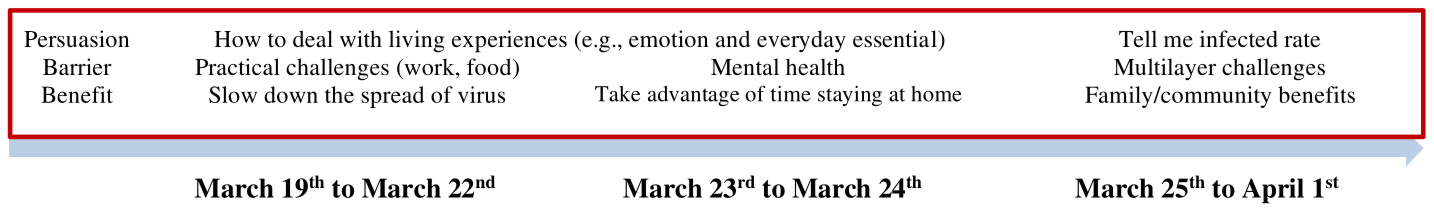
Figure 3 summarizes how public perception of effective persuasion, as well as attitudes related to barriers and benefits, evolved. In the very early days (March 19 to March 22 , 2020), people wanted to hear persuasive messages that can attend to their living experiences including emotion and everyday essential. They talked about societal-level benefits of social distancing, such as slowing down the spread of the virus and taking advantage of time staying at home for personal improvements. Practical barriers were salient such as unable to work at home or not having enough groceries. Concerns about mental health was a crucial barrier that people raised about social distancing. After the Safer-at-Home policy was in effect, people’s perception on the barriers became multilayered including practical challenges and mental challenges. And people began to point out that social distancing not only benefited themselves but also their family members and the larger community.
Personal experience and media coverage might explain why these changes took place. Initially, as the COVID-19 broke out in the news, public attention to and discussion of the impact of the disease were primarily restricted to its health effects. As the crisis escalated over time, and especially after the Safer-at-Home order was in place, the consequences of the pandemic have become more self-relevant, closer to home, and more complex than expected. People realized the multi-layered challenges, including health threats, job insecurity, financial crisis, and difficulties in getting daily necessities. This evolution in risk perceptions went in concert with the unfolding of the social context surrounding the COVID-19 pandemic [Alaszewski, 2005 ; Beck, 1992 ; Duff, 2003 ].
Our findings echoed existing scholarships that stress an essential feature of COVID-19 as its “wickedness” [Scheufele et al., 2020 ], under which people need to weigh different tensions of culture, lifestyle, physical and mental health, as well as economic costs. The weighing process differs among different publics [Villa, 2020 ]. These findings suggest the importance of studying how public risk perceptions evolve, which deserves more considerable empirical scholarly attention.
6.2 Lessons for (domestic and international) practitioners
This paper provides several important practical implications for health professionals, science communicators, and policymakers in the United States and over the globe. First, science communication needs to attend to the complexity of public opinion towards the different risks and uncertainties related to the COVID-19 outbreak, as well as barriers and benefits of practicing social distancing to combat coronavirus. Public attitudes are multi-layered, intertwined with different values, interests, and benefit and risk perceptions. Understanding the nuances of these attitudes is a first step to conduct targeted communication campaigns. As we have discussed, effective communication requires knowing your audience, especially with respect to their values, experiences, and attitudes, and knowing what messages are useful to them, given the barriers and benefits they perceive.
Expanding this crucial understanding of key audiences, our study demonstrates that people faced a wide range of barriers to practicing social distancing, ranging from health to economic reasons. Thus, segmenting audiences into more homogenous subgroups is crucial for developing the right messages to target subgroups’ attitudinal and behavioral change. For instance, one important group practitioners need to target are those who rarely practiced social distancing and we demonstrate that this group experienced more substantive opinion changes compared to everyone else throughout the course of the study period. Choosing the right messages to target this group might generate the most substantial effects of health campaigns for achieving higher rates of compliance with social distancing recommendations. In terms of messages, we suggest the following strategies during message campaign design:
- Make messages directly relevant to people’s personal experiences. As we found, participants perceived messages that consider their personal gains and losses to be more persuasive.
- Recognize and respond to the multi-dimensionality of people’s risk perceptions. There is no single risk or relevant consideration related to COVID-19. For instance, people pointed out multi-layered barriers ranging from mental health to their working situations. As science and health communicators, it is important to investigate a diverse range of barriers people might face when practicing precautionary actions. Barriers that people face might be very different from what the policymakers and communicators assume. These barriers are also contextual and need to adapt to local situations.
- Frame precautionary action in a positive manner. Instead of using fear to tell the public the consequences of not doing social distancing, positive framing such as self-improvement during stay at home can be effective. For example, our finding on self-improvement as a benefit suggests that one way to persuade people to perform social distancing is by focusing on the positive framing of social distancing, such as on the things people can enjoy during the pandemic. In addition to stressing social distancing is necessary to flatten the curve, which is quite abstract to the lay public, science and risk communicators should also focus on messages that attend to the personal relevancy of people’s lives and frame messages in a hopeful way to decrease uncertainties and anxieties among the public. In fact, CDC has reframed “social distancing” to “physical distancing” in April to address the negative framing in the former.
Second, science communication also needs to attend to the changing dynamics of public attitudes. As demonstrated by this study, at an early stage, people were not only ambivalent about the potential benefits of social distancing, but also lacked the experience of being socially isolated to deal with an unprecedented pandemic. As the perceived level of personal and societal threats increases, people were more likely to follow the new social norm of staying at home. However, our survey showed that people faced new challenges, such as distancing fatigue and uncertainties of future situations. Health practitioners and communicators need to provide continuous social support and update their messaging to address these new concerns. Public attitudes keep evolving as a combination of external drivers (e.g., case numbers, science discoveries, and overwhelming information) and internal changes (e.g., living demands, staying-at-home experience). It is crucial for practitioners to monitor public attitudes, risk perceptions, and reactions in order to know how communication messages and policies should change with updates from what the public needs.
Third, our study provides an example of how to efficiently track and analyze public opinion changes using a convenient web-survey and computational analysis methods. In the digital media era, social media platforms facilitate data collection that reaches out to a large number of people with low costs in a short period. However, there are two cautions about using web-surveys to understand public opinion during the pandemic. It is important to check the representativeness of the sample compared to the population and interpret findings cautiously. For another, some minority groups who do not have internet access are potentially the people whose voice needs to be heard the most. Health professionals, communicators, and policymakers need to use supplementary methods to know the struggles these people have. More importantly, our analyses showed the efficiency of computer-aided methods in analyzing big data. The open-source tool, structural topic model, used in this study, improves the accuracy and interpretability of open-ended responses by controlling for respondents’ characteristics and allows comparisons between periods and other factors. We suggest practitioners teaming up with data scientists, which will allow them to monitor large-scale public opinion in real time and fast. Moreover, the innovative computational method we used in this paper is valuable to international practitioners. It allows comparative analysis among states and countries, which is particularly important for policymakers to learn about during pandemic, as both the health crisis and public opinion surrounding it is global in nature.
Appendix A. Sample balance check
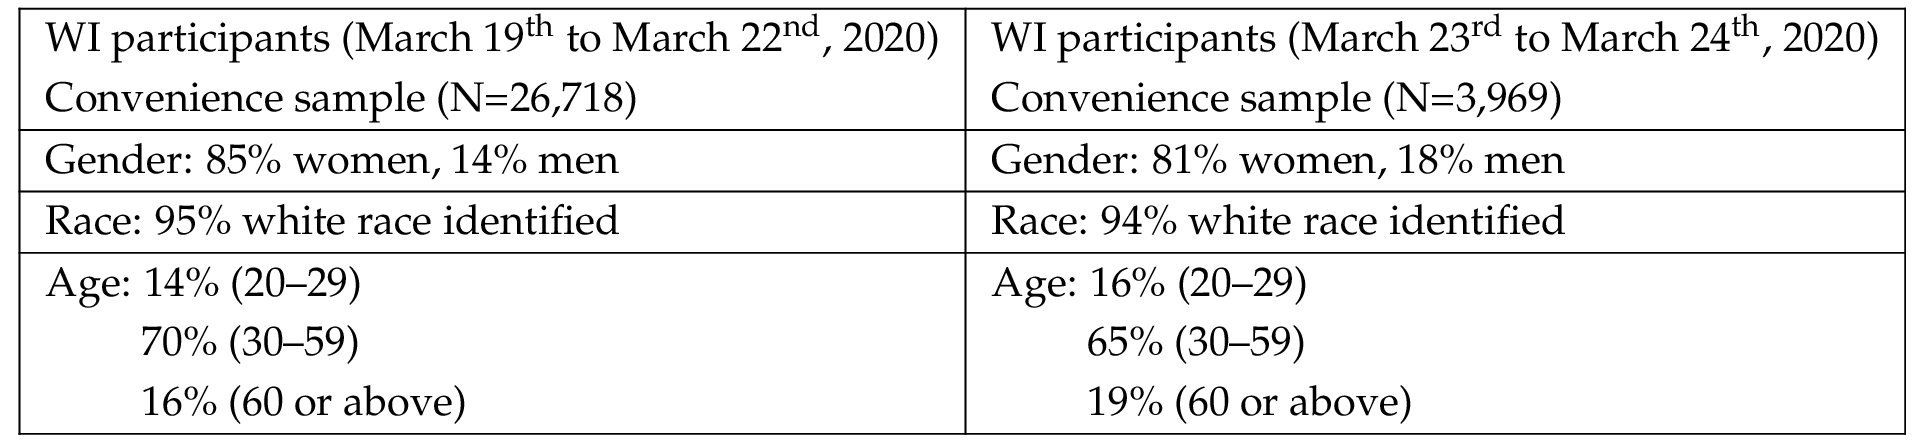
We conducted a sample balance check for the two key dates to examine to what extent participants around these two dates were similar in terms of gender, race, and age, which are factors that could influence how people experience and perceive COVID-19. 7 Table 1 describes the main demographic characteristics of the Wisconsin samples before and after the first key date (March 22 , 2020). These two Wisconsin samples are overall similar in terms of gender, race, and age. There is a little difference in gender and race and thus, we controlled for these two demographic characteristics when we compared participants’ opinions around March 22 , 2020.
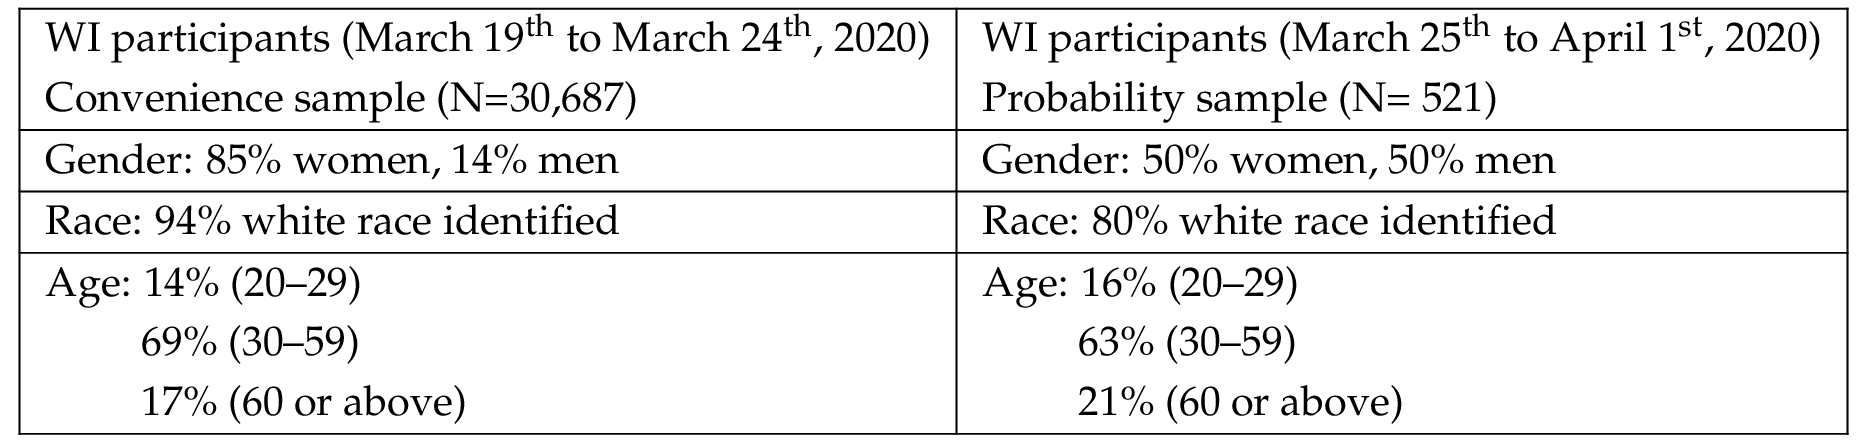
Table 2 describes the main demographic characteristics of the Wisconsin samples before and after the second key date (March 25 , 2020). We launched two surveys between March 19 to April 1 , 2020. The first survey used a convenience sampling method (conducted from March 19 to March 24, 2020) and the second survey used a probability sampling method (conducted from March 25 to April 1, 2020). Due to the difference in the sampling methods, we observed a substantial difference between these two samples in terms of gender and racial compositions. Therefore, we controlled for these two demographic variables when we compared participants’ opinions around our second key date.
Appendix B. Results
References
-
Abramowitz, A. I. (28th May 2020). Recent polling in the swing states favors Biden . URL: http://centerforpolitics.org/crystalball/articles/recent-polling-in-the-swing-states-favors-biden/ (visited on 23rd June 2020).
-
Akin, H. and Scheufele, D. A. (2017). ‘Overview of the science of science communication’. In: The Oxford handbook of the science of science communication. Ed. by K. H. Jamieson, D. M. Kahan and D. A. Scheufele. New York, NY, U.S.A.: Oxford University Press, pp. 25–33. https://doi.org/10.1093/oxfordhb/9780190497620.013.3 .
-
Alaszewski, A. (2005). ‘Risk communication: identifying the importance of social context1’. Health, Risk & Society 7 (2), pp. 101–105. https://doi.org/10.1080/13698570500148905 .
-
Andersen, M. (2020). ‘Early evidence on social distancing in response to COVID-19 in the United States’. SSRN Electronic Journal . https://doi.org/10.2139/ssrn.3569368 .
-
Bächtiger, A. (2018). ‘A preface to studying deliberation empirically’. In: The Oxford handbook of deliberative democracy. Ed. by A. Bächtiger, J. S. Dryzek, J. Mansbridge and M. Warren. New York, NY, U.S.A.: Oxford University Press, pp. 657–662. https://doi.org/10.1093/oxfordhb/9780198747369.013.57 .
-
Baum, N. M., Jacobson, P. D. and Goold, S. D. (2009). ‘“Listen to the people”: public deliberation about social distancing measures in a pandemic’. The American Journal of Bioethics 9 (11), pp. 4–14. https://doi.org/10.1080/15265160903197531 .
-
Beck, U. (1992). Risk Society: Towards a New Modernity. First published in German, 1986. London, U.K.: SAGE Publications.
-
Boulianne, S., Chen, K. and Kahane, D. (2020). ‘Mobilizing mini-publics: the causal impact of deliberation on civic engagement using panel data’. Politics . https://doi.org/10.1177/0263395720902982 .
-
Brossard, D. and Lewenstein, B. (2009). ‘A critical appraisal of models of public understanding of science: using practice to inform theory’. In: Communicating science. New agendas in communication. Ed. by L. Kahlor and P. Stout. New York, NY, U.S.A.: Routledge, pp. 11–39. https://doi.org/10.4324/9780203867631 .
-
Brossard, D. (2013). ‘New media landscapes and the science information consumer’. Proceedings of the National Academy of Sciences 110 (Supplement 3), pp. 14096–14101. https://doi.org/10.1073/pnas.1212744110 . PMID: 23940316 .
-
Brossard, D., Belluck, P., Gould, F. and Wirz, C. D. (2019). ‘Promises and perils of gene drives: navigating the communication of complex, post-normal science’. Proceedings of the National Academy of Sciences 116 (16), pp. 7692–7697. https://doi.org/10.1073/pnas.1805874115 .
-
Bubela, T., Nisbet, M. C., Borchelt, R., Brunger, F., Critchley, C., Einsiedel, E., Geller, G., Gupta, A., Hampel, J., Hyde-Lay, R., Jandciu, E. W., Jones, S. A., Kolopack, P., Lane, S., Lougheed, T., Nerlich, B., Ogbogu, U., O’Riordan, K., Ouellette, C., Spear, M., Strauss, S., Thavaratnam, T., Willemse, L. and Caulfield, T. (2009). ‘Science communication reconsidered’. Nature Biotechnology 27 (6), pp. 514–518. https://doi.org/10.1038/nbt0609-514 .
-
Campbell, M. R. and Brauer, M. (in press). ‘Social marketing campaigns to address social problems’. In: The Routledge research encyclopedia of psychology applied to everyday life. Ed. by R. A. R. Gurung. London, U.K.: Routledge.
-
Centers for Disease Control and Prevention (2018). CERC: messages and audiences . URL: https://emergency.cdc.gov/cerc/ppt/CERC_Messages_and_Audiences.pdf?fbclid=IwAR0a_eKfiSUIu7EJetxitNyubvqpu3-Q3YXYW6wD0cjdJhgWBSW6QV-v-_k .
-
— (2020a). CDC COVID data tracker . URL: https://www.cdc.gov/covid-data-tracker/index.html#learn-more .
-
— (2020b). Coronavirus disease 2019 (COVID-19) . URL: https://www.cdc.gov/coronavirus/2019-ncov/prevent-getting-sick/social-distancing.html .
-
Courtemanche, C., Garuccio, J., Le, A., Pinkston, J. and Yelowitz, A. (2020). ‘Strong social distancing measures in the United States reduced the COVID-19 growth rate’. Health Affairs 39 (7), pp. 1237–1246. https://doi.org/10.1377/hlthaff.2020.00608 .
-
Cramer, K. J. (2016). The politics of resentment: rural consciousness in Wisconsin and the rise of Scott Walker. Chicago, IL, U.S.A.: University of Chicago Press.
-
Dahlstrom, M. F., Dudo, A. and Brossard, D. (2012). ‘Precision of information, sensational information and self-efficacy information as message-level variables affecting risk perceptions’. Risk Analysis 32 (1), pp. 155–166. https://doi.org/10.1111/j.1539-6924.2011.01641.x .
-
Dietz, T. (2013). ‘Bringing values and deliberation to science communication’. Proceedings of the National Academy of Sciences 110 (S3), pp. 14081–14087. https://doi.org/10.1073/pnas.1212740110 .
-
Duff, C. (2003). ‘The importance of culture and context: rethinking risk and risk management in young drug using populations’. Health, Risk & Society 5 (3), pp. 285–299. https://doi.org/10.1080/13698570310001606987 .
-
Farber, S. E. and Johnson, J. (17th June 2020). ‘New data shows young people need to take social distancing seriously’. ABC News . URL: https://abcnews.go.com/Health/data-shows-young-people-social-distancing/story?id=71283384 .
-
Fishkin, J. S. (2018). Democracy when the people are thinking: revitalizing our politics through public deliberation. 1st ed. New York, NY, U.S.A.: Oxford University Press. https://doi.org/10.1093/oso/9780198820291.001.0001 .
-
French, B. (2005). ‘Evidence-based practice and the management of risk in nursing’. Health, Risk & Society 7 (2), pp. 177–192. https://doi.org/10.1080/13698570500108735 .
-
Greenstone, M. and Nigam, V. (2020). ‘Does social distancing matter?’ University of Chicago, Becker Friedman Institute for Economics working paper no. 2020-26. SSRN Electronic Journal . https://doi.org/10.2139/ssrn.3561244 .
-
Huynh, T. L. D. (2020). ‘Does culture matter social distancing under the COVID-19 pandemic?’ Safety Science 130, p. 104872. https://doi.org/10.1016/j.ssci.2020.104872 .
-
Jaja, I. F., Anyanwu, M. U. and Iwu Jaja, C.-J. (2020). ‘Social distancing: how religion, culture and burial ceremony undermine the effort to curb COVID-19 in South Africa’. Emerging Microbes & Infections 9 (1), pp. 1077–1079. https://doi.org/10.1080/22221751.2020.1769501 .
-
Jamieson, K. H., Kahan, D. M. and Scheufele, D. A., eds. (2017). The Oxford handbook of the science of science communication. New York, NY, U.S.A.: Oxford University Press. https://doi.org/10.1093/oxfordhb/9780190497620.001.0001 .
-
Kasperson, R. E., Renn, O., Slovic, P., Brown, H. S., Emel, J., Goble, R., Kasperson, J. X. and Ratick, S. (1988). ‘The social amplification of risk: a conceptual framework’. Risk Analysis 8 (2), pp. 177–187. https://doi.org/10.1111/j.1539-6924.1988.tb01168.x .
-
Krause, N. M., Freiling, I., Beets, B. and Brossard, D. (2020). ‘Fact-checking as risk communication: the multi-layered risk of misinformation in times of COVID-19’. Journal of Risk Research , pp. 1–8. https://doi.org/10.1080/13669877.2020.1756385 .
-
Kunda, Z. (1990). ‘The case for motivated reasoning’. Psychological Bulletin 108 (3), pp. 480–498. https://doi.org/10.1037/0033-2909.108.3.480 .
-
Lee, N. R. and Kotler, P. (2019). Social marketing: behavior chance for social good. 6th ed. Thousand Oaks, CA, U.S.A.: SAGE.
-
McCann, A. (2nd December 2019). ‘States with the most racial progress’. WalletHub . URL: https://wallethub.com/edu/safest-cities-in-america/41926/ .
-
Miller, S., Fahy, D. and the ESConet Team (2009). ‘Can Science Communication Workshops Train Scientists for Reflexive Public Engagement?’ Science Communication 31 (1), pp. 116–126. https://doi.org/10.1177/1075547009339048 .
-
National Academies of Sciences, Engineering and Medicine (2016). Science literacy: concepts, contexts and consequences. Washington, DC, U.S.A.: The National Academies Press. URL: https://www.nap.edu/catalog/23595/science-literacy-concepts-contexts-and-consequences .
-
— (2017). Communicating science effectively: a research agenda. Washington, DC, U.S.A.: The National Academies Press. URL: https://www.nap.edu/read/23674/chapter/1 .
-
Nelkin, D. (1995). Selling science: how the press covers science and technology. New York, NY, U.S.A.: W.H. Freeman.
-
Nyhan, B., Reifler, J., Richey, S. and Freed, G. L. (2014). ‘Effective messages in vaccine promotion: a randomized trial’. Pediatrics 133 (4), e835–e842. https://doi.org/10.1542/peds.2013-2365 .
-
Oosterhoff, B., Palmer, C. A., Wilson, J. and Shook, N. (2020). ‘Adolescents’ motivations to engage in social distancing during the COVID-19 pandemic: associations with mental and social health’. Journal of Adolescent Health 67 (2), pp. 179–185. https://doi.org/10.1016/j.jadohealth.2020.05.004 .
-
Raisio, H. (2010). ‘The public as policy expert: deliberative democracy in the context of Finnish health care reforms and policies’. Journal of Deliberative Democracy 6 (2), p. 6. https://doi.org/10.16997/jdd.111 .
-
Ravetz, I. (1999). ‘What is post-normal science’. Futures — the Journal of Forecasting Planning and Policy 31 (7), pp. 647–654.
-
Rittel, H. W. J. and Webber, M. M. (1973). ‘Dilemmas in a general theory of planning’. Policy Sciences 4 (2), pp. 155–169. https://doi.org/10.1007/BF01405730 .
-
Roberts, M. E., Stewart, B. M. and Tingley, D. (2019). ‘stm: an R package for structural topic models’. Journal of Statistical Software 91 (2), pp. 1–40. https://doi.org/10.18637/jss.v091.i02 .
-
Roberts, M. E., Stewart, B. M., Tingley, D., Lucas, C., Leder-Luis, J., Gadarian, S. K., Albertson, B. and Rand, D. G. (2014). ‘Structural topic models for open-ended survey responses’. American Journal of Political Science 58 (4), pp. 1064–1082. https://doi.org/10.1111/ajps.12103 .
-
Rose, K. M., Brossard, D. and Scheufele, D. A. (2020). ‘Of society, nature and health: how perceptions of specific risks and benefits of genetically engineered foods shape public rejection’. Environmental Communication , pp. 1–15. https://doi.org/10.1080/17524032.2019.1710227 .
-
Saluja, G. (7th April 2020). ‘We’re not all in this together. Messages about social distancing need the right cultural fit’. The Conversation . URL: https://theconversation.com/were-not-all-in-this-together-messages-about-social-distancing-need-the-right-cultural-fit-135427 .
-
Scheufele, D. A. (2014). ‘Science communication as political communication’. Proceedings of the National Academy of Sciences 111 (Supplement 4), pp. 13585–13592. https://doi.org/10.1073/pnas.1317516111 .
-
Scheufele, D. A., Krause, N. M., Freiling, I. and Brossard, D. (17th April 2020). ‘How not to lose the COVID-19 communication war’. Issues in Science and Technology . URL: https://issues.org/covid-19-communication-war/ .
-
Trench, B. (2008). ‘Towards an analytical framework of science communication models’. In: Communicating science in social contexts. Dordrecht, The Netherlands: Springer, pp. 119–135. https://doi.org/10.1007/978-1-4020-8598-7_7 .
-
U.S. Census (2019). QuickFacts Wisconsin . URL: https://www.census.gov/quickfacts/WI .
-
Villa, V. (27th April 2020). Most states have religious exemptions to COVID-19 social distancing rules . URL: https://pewrsr.ch/3bHDndx .
-
Welp, M., de la Vega-Leinert, A. C., Stoll-Kleemann, S. and Fürstenau, C. (2006). ‘Science-based stakeholder dialogues in climate change research’. In: Stakeholder dialogues in natural resources management. Berlin, Heidelberg, Germany: Springer, pp. 213–240. https://doi.org/10.1007/978-3-540-36917-2_8 .
-
Wynne, B. (2006). ‘Public Engagement as a Means of Restoring Public Trust in Science — Hitting the Notes, but Missing the Music?’ Community Genetics 9 (3), pp. 211–220. https://doi.org/10.1159/000092659 .
Authors
Kaiping Chen is an Assistant Professor in Computational Communication at the Life Sciences Communication Department at the University of Wisconsin-Madison. E-mail: kchen67@wisc.edu .
Luye Bao is a Ph.D. student at the Life Sciences Communication Department at the University of Wisconsin-Madison. E-mail: lbao6@wisc.edu .
Anqi Shao is a Ph.D. student at the Life Sciences Communication Department at the University of Wisconsin-Madison. E-mail: anqi.shao@gmail.com .
Pauline Ho is a Ph.D. student at the University of Wisconsin-Madison School of Education. E-mail: pho25@wisc.edu .
Shiyu Yang is a Ph.D. student at the Life Sciences Communication Department at the University of Wisconsin-Madison. E-mail: syang364@wisc.edu .
Christopher Wirz is a Ph.D. student at the Life Sciences Communication Department at the University of Wisconsin-Madison. E-mail: cdwirz@gmail.com .
Dominique Brossard is professor and chair in the Department of Life Sciences Communication at the University of Wisconsin-Madison. E-mail: dbrossard@wisc.edu .
Markus Brauer is a professor in the Department of Psychology at the University of Wisconsin-Madison. E-mail: brauer2@wisc.edu .
Lori Brown is a distinguished faculty associate in civil society and community studies at the School of Human Ecology at the university of Wisconsin-Madison. E-mail: dipretbrown@wisc.edu .
Endnotes
1 The terms ‘social distancing’ and ‘physical distancing’ are both regularly used to describe the practice of keeping at least six feet between yourself and others when in public places. For the sake of clarity, we only use ‘social distancing’ in this paper to refer to this practice.
2 In May 2020, there has been some legal challenges to the Governor’s Safer-at-Home orders. The state Supreme Court has overturned it.
3 For median and quantile values of mobility patterns of Wisconsin residents for March 21 to March 23 , please see appendix -> Mobility data: median and quantiles.
4 We added gender and race as control variables for two reasons. First, gender and race experienced a slight change when we compared different samples before and after our key dates. Secondly, we also conducted a STM analysis comparing how women participants answered the persuasion survey questions differently from participants identifying as men. Table 18 in the appendix shows that men are slightly more likely to mention the risk of the virus for people when considering persuasive messages to make them perform social distancing (e.g. topic 2, 9 and 10), and women wanted to hear messages about how they can still perform work and life necessities (e.g. topic 3, and 8), and expressed their concerns about their friend and loved ones (topic 7).
5 To determine the number of topics we would use from STM to analyze people’s answers, we compared the held-out likelihood, residual, semantic coherence of models with 5 to 20 topics. The model with 10 topics yielded the most intuitive results and forms the focus of subsequent analysis. Several researchers hand labeled each topic by reading documents associated with the topic, by examining the words that appear with the highest probability in that topic, and by examining the words that are frequent and exclusive to that topic. To ensure that the interpretation of the topic model is as comprehensive as possible, three researchers read and interpret the output of topic models.
6 For details on tables in this result section, please refer to appendix.
7 There are many discussions as well surveys about this observation. Some examples include: https://www.nytimes.com/2020/06/24/opinion/sex-differences-covid.html ; https://www.pewresearch.org/fact-tank/2020/06/05/black-u-s-adults-follow-many-COVID-19-news-topics-more-closely-discuss-the-outbreak-more-frequently/ ; https://www.medrxiv.org/content/10.1101/2020.04.08.20057067v1 .