

Quantitative surveys on public opinion towards science typically show high levels of trust in the scientific endeavour [Cologna et al., 2025; Post & Bienzeisler, 2024]. But these findings might be biased because our field, science communication research, relies heavily on samples drawn from access panels,1 groups of participants typically pre-recruited by companies. Participants usually self-select into such panels. Thus, panellists do not represent the general public, that is, all humans in a society. For example, they tend to be less open-minded [Valentino et al., 2020]. They also tend to be interested in science [cf. Cooper & Farid, 2016; Kennedy et al., 2016] — and probably trust science more than the average citizen. As a one-size-fits-all solution, science communication researchers often rely on demographic quotas, for example splitting gender evenly and matching age groups to their proportions in the general public. However, demographic stratification cannot fully ensure sample quality; a sample can resemble the general public in terms of age and gender, but participants may differ in how much they trust science.
What is more, researchers may have misconceptions about how access panels work: one of the authors of this article worked for an online access panel and observed that academic clients sometimes overestimated their methodological skills and their relevance within the priorities of the panel business. Academic researchers can be described as low-volume, low-priority clients. Though this is only anecdotal evidence, we suspect it contains some truth. Moreover, sampling is only one element of the research process alongside questionnaire design, analysis, and reporting. In practice, it may receive less attention than these other stages. Thus, we call for stronger methodological reflection: this may require exploring new approaches to better capture the diversity of public opinion toward science.
The aim of this paper is threefold: first, we outline methodological principles behind sampling before presenting common sampling procedures. Second, we assess methodological trends in science communication survey research by reviewing quantitative survey studies. Third, we highlight pathways that offer potential for improving sampling practices and that are no rocket science.
1 Sampling procedures
Research on public opinion toward science requires sampling, the process of selecting so-called sampling units (e.g., people) from a population (e.g., the general public) through sampling procedures (cf. Table 1 for an overview of key terms) to then draw conclusions about the population [Brick, 2011; Kish, 1969; Lowry, 1979]. Crucially, we need to carefully specify the population under study and the sampling procedures we use to ensure validity [Lowry, 1979]. Validity refers to how sure we can be that our claims are accurate [Field et al., 2012, p. 12; Kelly & Westerman, 2020].
| Term |
Definition |
| Population |
Full set of sampling units about which we aim to draw conclusions (e.g., the general public) |
| Sampling unit |
Elements that comprise a population (e.g., people, groups). |
| Sampling procedures |
Methods used to select sampling units from a population. |
| Sampling frame |
Lists from which sampling units are selected. |
| Sampling mechanism |
An instrument to select sampling units by chance without a sampling frame. |
| Full sample |
A sampling procedure in which all sampling units of a population are included. |
| Probability sampling |
A sampling procedure in which sampling units are selected by chance (e.g., from a sampling frame or through a sampling mechanism). |
| Non-probability sampling |
A sampling procedure in which sampling units are not selected by chance. |
| Stratification |
A sampling procedure in which the population is divided into predefined groups (e.g., gender) and sampling units are selected (based on quotas) so that their proportions match those in the population. |
| Post-stratification |
A procedure in which sample data are weighted after data collection so that the proportions of groups (e.g., gender) match those in the population. |
| Non-response bias |
Bias that occurs when individuals selected for a sample do not participate. |
| Self-selection bias |
Bias that occurs when individuals self-select into a sample. |
| Selection bias |
Bias introduced by researchers when the sampling procedure itself produces systematic distortion. |
Scholars have long distinguished between internal and external validity [cf. McEwan, 2020]. Internal validity concerns how confidently we can say that the observed effects in a study are caused by the variables we measured. When internal validity is high, observed effects can be attributed to the variables under study. Internal validity is of utmost importance when we aim to isolate the effects of specific variables [cf. Baker et al., 2013]. External validity, on the other hand, concerns how well observed effects can be generalized. When external validity is high, the observed patterns among measured variables are likely to occur in the wider population [Lowry, 1979]. External validity is important when we aim to describe or compare populations. However, it is less essential when the goal is to examine relationships between variables or isolate effects [cf. Baker et al., 2013].
In public opinion research, we often draw inferences about populations from imperfect samples; according to Kish [1969, p. 18], this is much like judging a basket of different fruits by inspecting only a picked grape. The external validity of surveys, therefore, depends on how we sample (how we pick the fruits) and who we sample (from which basket the fruits are picked). When external validity is high, findings from a sample can be generalized to the population (all fruits in all baskets) under study [cf. Brick, 2011; Lowry, 1979; Neyman, 1934]. External validity is compromised when samples capture only segments (certain fruits in some baskets) of a population [cf. Cooper & Farid, 2016; Lowry, 1979]. For example, surveying university students would not allow us to make meaningful claims about the general public’s trust in science. Thus, adequate sampling procedures are more important for valid conclusions than simply chasing large sample sizes.
Hence, the choice of a sampling procedure for a survey is not trivial but a matter of choosing appropriate methods for a specific research context. Like judging the quality of fruits, we must decide where to invest effort [cf. Baker et al., 2013; Brick, 2011]: whether to inspect many baskets, examine a few fruits more carefully, or spend more time describing what we find. Because perfect sampling procedures are rarely possible within limited resources, it is important to report how samples were selected so that readers can judge our conclusions.
In the following, we will outline common sampling procedures and discuss their strengths and limitations for science communication research.
1.1 Complete samples
Complete sampling procedures (also called census) gather information from every sampling unit of a population. Therefore, they allow us to make direct observations about population characteristics, even without inferential statistics [cf. Baker et al., 2013]. When we survey all science journalists in two countries, we can compare their answers without relying on significance tests.
In science communication research, surveys of scientists often aim to cover entire populations [e.g., Bienzeisler, 2026]. However, complete samples are rare due to the high costs and logistical challenges involved. Moreover, they are vulnerable to non-response bias. When non-participants differ systematically from participants, results are biased [McEwan, 2020; Smith, 1983]. Thus, a complete sample is only feasible if all individuals in a population can be contacted and a sufficient number choose to respond. Still, complete sampling procedures are effective when applied to small and well-defined populations.
1.2 Probability samples
Probability sampling procedures gather information from a subset of a population and are the ‘gold standard’ of public opinion research [cf. McEwan, 2020]. As sampling entire populations is often unrealistic, researchers typically collect a number of observations to allow for statistical inference: they draw conclusions about a population based on patterns observed in a number of randomly selected sampling units [cf. McEwan, 2020; Smith, 1983]. When we work with probability samples of science journalists from two countries, we can use significance tests to determine whether differences in their answers are meaningful.
To select a probability sample, we must choose sampling units, such as individuals, school classes, or groups, at random [Brick, 2011]. Probability samples can be drawn by selecting sampling units by chance from a sampling frame, that is, a list from which units are selected. Common sampling frames include population registers or telephone directories. Alternatively, we may use sampling mechanisms, such as random-digit dialling, systematic selection procedures, or multiple steps to generate probability samples without lists. For example, we can select random polling stations during an election and invite every fifth voter to take part in a post-election survey, thereby sampling clusters of voters. We then estimate population characteristics based on the principle that our random sample is one of many possible samples from the population [cf. McEwan, 2020; Neyman, 1934]. To assess how well our sample statistic reflects the population, we report the extent to which our result might vary by chance, known as the standard error [Field et al., 2012, p. 12].
In science communication research, large-scale studies, such as the Swiss Science Barometer, rely on probability sampling [Schäfer et al., 2021]. Probability samples are often presented as a requirement for statistical inference [cf. McEwan, 2020]. However, they necessitate adequate procedures, as lists of entire populations are rarely available. Restrictive sampling frames or mechanisms — for instance, those based solely on landline phone book entries — can systematically exclude individuals. This slant introduced by researchers themselves is called selection bias. Thus, findings from a probability sample are only generalizable if population members are reachable, willing to respond, and the randomization is accurate. Therefore, implementing probability sampling is nearly impossible for smaller projects [cf. McEwan, 2020].
1.3 Non-probability samples
Non-probability sampling procedures provide an alternative to complete and probability samples, typically used when other sampling procedures are not feasible. Non-probability sampling is an umbrella term that covers a range of methods without a unified framework [Baker et al., 2013]. According to the American Association for Public Opinion Research (AAPOR), non-probability sampling is a “method of collecting data that does not have a theory to support inferences” [Baker et al., 2013, p. 95]. Two major types of non-probability samples are convenience and snowball samples. A convenience sample is a non-probability sample drawn from individuals who are easily accessible to researchers, such as students, users of crowdsourcing platforms, or members of a panel [Erba et al., 2018; McEwan, 2020; Saumure & Given, 2008]. Panellists, for example, are ‘groomed’ to participate in as many surveys as possible, which makes their participation in surveys non-random. All access panel samples are therefore convenience samples [cf. Baker et al., 2013].2 A snowball sample is a non-probability sample where participants refer additional participants they know [Brick, 2011]. For hard-to-reach populations, snowball sampling is often the only feasible option [cf. Brick, 2011].
Non-probability samples do not offer the same possibilities as probability samples for making statistical inferences [cf. Baker et al., 2013; Mercer & Lau, 2023; Smith, 1983]. We cannot, for example, survey science journalists from two countries who happen to attend a conference and claim to compare all journalists in both countries, even if we conduct significance tests. Such samples are difficult to evaluate because it remains unclear how well they represent a population [Baker et al., 2013; cf. Brick, 2011]. Thus, by definition, a non-probability sample cannot be generalized without further ado [cf. Baker et al., 2013]. Nevertheless, it can offer partial insights at the cost of introducing self-selection bias in addition to selection and non-response bias [cf. McEwan, 2020; Saumure & Given, 2008]. Such bias occurs when participants choose themselves.
1.4 Purposeful samples
Purposive sampling procedures move away from the logic of statistical inference and are commonly used in qualitative research [Patton, 2003, p. 230]. In purposive sampling, we aim to maximize opportunities for meaningful insights by deliberately selecting sampling units [Corbin & Strauss, 2008, pp. 143–158]. Such approaches include maximum variation sampling, which captures broad differences, and homogeneous sampling, which focuses on similar cases [Patton, 2003, pp. 230–247]. Purposeful samples do not allow for statistical inference: if we select the most different science journalists in two countries, we learn about variation but cannot infer anything about the average journalist. Moreover, such sampling allows us to adapt to analytical needs, as we often begin with an initial set of sampling units and refine our sample based on emerging variation in the data [Butler et al., 2018].
In science communication research, purposeful samples are used, for example, to investigate science communication audience segments [Humm et al., 2020; Koch et al., 2020]. Such samples do not allow for generalizable claims. Thus, a purposeful sample is not generalizable by design. However, they can help, for example, to examine individuals with extreme positions.
1.5 Adjustments
Stratification. To address the limitations of imperfect sampling procedures, researchers often turn to stratification, also known as quota sampling. In quota sampling, we select participants from a non-probability or random sample to match characteristics of a population, such as age, gender, or education [Brick, 2011]. The aim of a stratified sample is to mirror the proportions of key groups in the population and thus enhance external validity. Non-probability samples with applied quotas can serve as an alternative to probability sampling [Cumming, 1990]. However, such procedures do not always ensure the same level of external validity [Yang & Banamah, 2014].
Post-stratification. As an alternative to quota sampling, researchers can apply post-stratification techniques that apply weights [Baker et al., 2013]. The aim of post-stratification is to adjust the sample after data collection to better reflect the population and enhance external validity. For example, when surveying science journalists, responses could be weighted to match the known distribution of journalists across media types. Thus, even a non-probability sample may be considered generalizable if appropriate weights are applied [though this remains a subject of ongoing debate, e.g., Andridge et al., 2019; Baker et al., 2013; Valliant & Dever, 2011]. However, all adjustments depend on the availability of auxiliary variables.
2 Literature review
We have highlighted that different sampling procedures have their own strengths and limitations. Non-probability samples from access panels may be convenient, but they carry risks like self-selection bias. More targeted methods, such as randomized post-election surveys, can avoid some of these issues. However, we do not know how science communication researchers select their samples. To address our second research goal, to assess methodological trends in science communication survey research, we conduct a systematic literature review following PRISMA guidelines [Page et al., 2021]. We analysed all original research papers published between 2014 and 2025 in the three leading outlets for science communication research, the Journal of Science Communication, Public Understanding of Science, and Science Communication, reporting quantitative surveys.3 In the following, we examine (1) which sampling procedures science communication researchers use. To do so, we cluster studies according to their approaches. Moreover, we investigate (2) if sampling procedures have changed over time and (3) whether science communication researchers reflect limitations related to sampling.
3 Methods
3.1 Literature selection
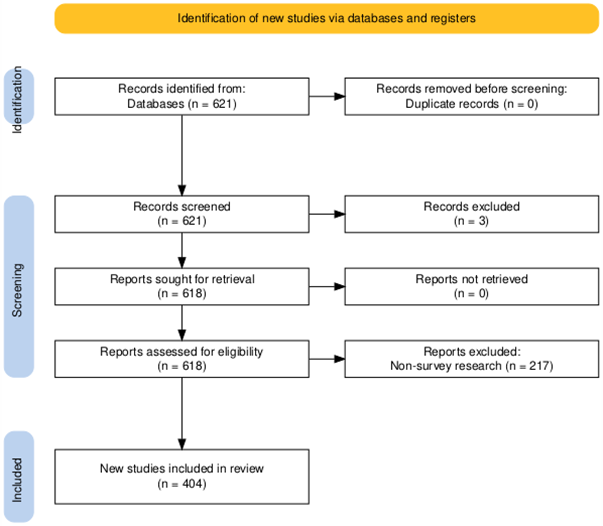
We extracted 181 original research articles published between 2015 and October 20254 in the Journal of Science Communication from lens.org with a search string.5 Similarly, 264 original research articles published in Public Understanding of Science, and 176 in Science Communication were retrieved from the Web of Science. We excluded three studies that were incorrectly labelled as original research articles.
One of the authors6 then identified relevant papers presenting results from quantitative surveys, using title, abstract, and keywords as selection criteria: 86 from the Journal of Science Communication, 174 from Public Understanding of Science, and 144 from Science Communication. We excluded 217 studies based on qualitative interviews, literature reviews, or other non-empirical work. For example, we excluded a literature review on issue case selection [Xenos et al., 2025]. In total, we analysed N = 404 studies (cf. Figure 1).
3.2 Coding procedures
We developed a codebook to capture the sampling procedures used by science communication researchers and the limitations they report. Two researchers conducted the coding. The two coders independently coded a subsample of 24 papers, and we assessed the reliability of coding using intercoder agreement (cf. Table 2). Subsequently, one coder continued with the full analysis.7
| Sample
| ||
| Agreement in % | Krippendorff’s α | |
|
Population (general public, journalists, scientists, etc.) | 100.0 | 1.00 |
|
Sampling procedure (complete, probability, non-probability sample, etc.) | 91.7 | .83 |
|
Selection of full and probability samples (random-digit dialling, sampling frames, etc.) | 100.0 | 1.00 |
|
Recruitment (email, panel, phone, etc.) | 100.0 | 1.00 |
|
Stratification (yes, no) | 100.0 | 1.00 |
|
Post-stratification (yes, no) | 100.0 | 1.00 |
| Limitations | ||
| Agreement in % | Krippendorff’s α | |
|
Non-response (yes, no) | 100.0 | 1.00 |
|
Self-selection (yes, no) | 95.8 | .84 |
|
Selection bias (yes, no) | 95.8 | .84 |
|
Randomization (yes, no) | 95.8 | .84 |
| Further Coding
| ||
| Agreement in % | Krippendorff’s α | |
|
Design (cross-sectional, experiment, etc.) | 95.8 | .93 |
|
Sample size | 91.7 | .92 |
|
National context | 100.0 | 1.00 |
|
Response rate | 95.8 | .89 |
|
Secondary use (yes, no) | 95.8 | .84 |
|
A priori power analysis (yes, no) | 100.0 | 1.00 |
| Note:
the
table
shows
coding
categories
and
the
results
of
intercoder
reliability
tests. | ||
Sampling procedures. First, we coded the population under study (general public, specific public, science journalists, science communicators, scientists, students) and second, the general sampling procedure (complete, probability, non-probability, purposeful sample). For complete and probability samples, we distinguished by selection criteria coding either sampling mechanism (random-digit dialling, systematic selection, other), sampling frames (list-based selection), or mixed approaches. Third, we noted the recruitment mode (email, face-to-face, micro-tasking platform, access panel, postal mail, social media, telephone, mixed, other) and fourth, coded whether stratification or post-stratification techniques were applied.
Limitations. We coded whether authors addressed methodological limitations. Specifically, we examined whether they discussed missing randomization and potential biases (non-response, self-selection, selection bias).
Further context. We coded the research design (cross-sectional, longitudinal, experimental, mixed), sample size, national context, secondary data use, and response rates. Moreover, we coded whether science communication researchers planned their sample sizes based on an a priori power analysis.
4 Results
4.1 Samples
We first examined the samples used by science communication researchers and how these samples are presented, to address our first research question. Science communication researchers most often survey the general public, accounting for the majority of the 404 studies in our sample (cf. Table 3). Far fewer studies target a specific public, such as visitors [e.g., Fogg-Rogers et al., 2015] and parents [e.g., Shauli & Baram-Tsabari, 2019], use student samples [e.g., Hendriks et al., 2016], focus on scientists [e.g., Besley et al., 2020], or study science communicators, such as PR officers [e.g., Fürst et al., 2022]. Only four studies survey journalists [e.g., Guenther & Ruhrmann, 2016]. The median number of participants across all studies is 797. Most samples — 195 in total — are drawn from the United States (U.S., 48%), followed by 46 samples from Germany (11%). Of all studies reviewed, 41 are international comparative (10%) and merely 38 studies draw samples from outside Western, educated, industrialized, rich, and democratic (WEIRD) contexts (9%).
| Media effects | Non-randomized | Randomized | Communicators | Audiences | Other | All
| |||||||||
| n | % | n | % | n | % | n | % | n | % | n | % | n | % | ||
| Design | Cross-sectional | 0 | 0.0 | 63 | 81.8 | 34 | 82.9 | 48 | 96.0 | 16 | 8.0 | 29 | 82.9 | 190 | 47.0 |
| Longitudinal | 16 | 8.8 | 14 | 18.2 | 7 | 17.1 | 1 | 2.0 | 3 | 15.0 | 3 | 8.6 | 44 | 10.9 | |
| Experiment | 160 | 88.4 | 0 | 0.0 | 0 | 0.0 | 1 | 2.0 | 1 | 5.0 | 2 | 5.7 | 164 | 4.6 | |
| Population | General public | 146 | 8.7 | 73 | 94.8 | 38 | 92.7 | 0 | 0.0 | 1 | 5.0 | 11 | 31.4 | 269 | 66.6 |
| Specific public | 6 | 3.3 | 1 | 1.3 | 3 | 7.3 | 0 | 0.0 | 18 | 9.0 | 21 | 6.0 | 49 | 12.1 | |
| Journalists | 0 | 0.0 | 0 | 0.0 | 0 | 0.0 | 4 | 8.0 | 0 | 0.0 | 0 | 0.0 | 4 | 1.0 | |
| Communicators | 0 | 0.0 | 0 | 0.0 | 0 | 0.0 | 16 | 32.0 | 0 | 0.0 | 0 | 0.0 | 16 | 4.0 | |
| Scientists | 0 | 0.0 | 0 | 0.0 | 0 | 0.0 | 28 | 56.0 | 0 | 0.0 | 0 | 0.0 | 28 | 6.9 | |
| Students | 25 | 13.8 | 3 | 3.9 | 0 | 0.0 | 0 | 0.0 | 0 | 0.0 | 1 | 2.9 | 29 | 7.2 | |
| Sampling | Probability | 2 | 1.1 | 0 | 0.0 | 41 | 10.0 | 8 | 16.0 | 2 | 10.0 | 2 | 5.7 | 55 | 13.6 |
| Complete | 1 | .6 | 0 | 0.0 | 0 | 0.0 | 19 | 38.0 | 0 | 0.0 | 4 | 11.4 | 24 | 5.9 | |
| Non-probability | 175 | 96.7 | 68 | 88.3 | 0 | 0.0 | 22 | 44.0 | 17 | 85.0 | 29 | 82.9 | 311 | 77.0 | |
| Recruitment | Face-to-Face | 6 | 3.3 | 2 | 2.6 | 12 | 29.3 | 3 | 6.0 | 11 | 55.0 | 4 | 11.4 | 38 | 9.4 |
| Post | 0 | 0.0 | 0 | 0.0 | 4 | 9.8 | 1 | 2.0 | 0 | 0.0 | 0 | 0.0 | 5 | 1.2 | |
| Telephone | 2 | 1.1 | 1 | 1.3 | 14 | 34.1 | 1 | 2.0 | 0 | 0.0 | 2 | 5.7 | 20 | 5.0 | |
| 6 | 3.3 | 3 | 3.9 | 0 | 0.0 | 33 | 66.0 | 1 | 5.0 | 6 | 17.1 | 49 | 12.1 | ||
| Panel | 94 | 51.9 | 50 | 64.9 | 0 | 0.0 | 0 | 0.0 | 0 | 0.0 | 9 | 25.7 | 153 | 37.9 | |
| Social Media | 5 | 2.8 | 2 | 2.6 | 0 | 0.0 | 1 | 2.0 | 2 | 10.0 | 5 | 14.3 | 15 | 3.7 | |
| Micro-tasking | 36 | 19.9 | 4 | 5.2 | 0 | 0.0 | 0 | 0.0 | 0 | 0.0 | 0 | 0.0 | 40 | 9.9 | |
| Adjustment | Stratification | 65 | 35.9 | 36 | 46.8 | 11 | 26.8 | 2 | 4.0 | 2 | 10.0 | 12 | 34.3 | 128 | 31.7 |
| Post-stratification | 15 | 8.3 | 17 | 22.1 | 15 | 36.6 | 1 | 2.0 | 1 | 5.0 | 1 | 2.9 | 50 | 12.4 | |
Moreover, science communication research predominantly relies on non-probability samples. In contrast, only fractions employ probability sampling or use complete samples. Of the studies that do, list-based sampling frames are most prominent — 34 studies (8%) — followed by the use of random-digit dialling as sampling mechanism in 15 studies (4%). Purposive sampling is not applied in any of the studies reviewed. Researchers commonly recruit their samples through access panels. Email invitations are the second most frequent method, followed by micro-tasking platforms like MTurk, face-to-face recruitment, telephone interviews, and social media platforms. Postal mail is used in only five studies. In our sample, roughly a third of studies used stratified samples with quotas (e.g., for age and gender), while only a tenth applied post-stratification to adjust samples (e.g., for non-response). Samples are rarely planned a priori, as only 36 studies report conducting a power analysis (9%).
To answer our first research question on sampling procedures in science communication research in more detail, we grouped the studies into ideal-typical groups by identifying recurring patterns.8
Media effects samples. The majority of studies in our sample — 182 in total (45%) — focus on media effects. These studies use experimental or longitudinal designs to investigate media use [e.g., Wonneberger et al., 2020], framing effects [e.g., Gustafson et al., 2025], or related topics. An example is Schug et al. [2024], who conducted an online survey via a panel provider to study how 1,007 Germans perceive the trustworthiness of scientists, portrayed in mass media, working in both controversial and non-controversial fields.
Media effects samples are most often drawn from the general public, while a notable minority relies on students. The median sample size is 676 participants. In 124 cases, data were collected in the U.S. (68%), and in 26 cases, in Germany (14%). Only four studies are designed as international comparative (2%), while nine include samples outside of WEIRD contexts (5%). Almost all media effect studies rely on non-probability samples of the general public; only two use probability sampling. Most often, participants are recruited from access panels and micro-tasking platforms. Media effects studies often apply quota-based stratification yet rarely adjust their samples through post-stratification. Media effects samples account for practically all reported power analyses, with 32 studies (18%) reporting this.
Overall, media effects samples are mainly non-probability and drawn from U.S. access panels or micro-tasking platforms. As predominantly experimental research, the studies prioritize internal validity over external. Accordingly, random assignment to experimental groups is most important [cf. Baker et al., 2013]. Accordingly, we consider these samples robust.
Non-randomized public opinion research samples. The second-largest share in our sample — 77 studies in total (19%) — comprises public opinion research based on non-probability samples. These studies rely on cross-sectional and longitudinal designs to explore public attitudes [e.g., Fung et al., 2026] or trust in science and science communication [e.g., Klinger et al., 2022], often in relation to demographic, psychological, or media use variables. An example is Chang et al. [2018], who used a non-probability sample of 1,001 South Koreans recruited via an online access panel with quotas for age, gender, and region, to examine how media use reinforces or reduces knowledge gaps between educational groups.
The vast majority of non-randomized public opinion samples consist of members of the general public. The median sample size is considerably large, at 1,407 participants, and data is predominantly collected in the U.S. (42%). 12 studies are international-comparative in scope (16%). Only six studies draw on samples out of WEIRD contexts (8%). None of the studies in this group employ probability sampling; instead, they rely exclusively on non-probability sampling. Most commonly, participants are recruited via access panels. A substantial share of studies applies stratification to approximate population characteristics, and a higher-than-average proportion apply post-stratification to adjust for known biases.
Overall, non-randomized public opinion samples are primarily used to examine correlations in non-experimental research, making external validity important. The external validity of non-randomized samples in science communication research is, however, limited. Thus, we consider these samples as less robust.
Randomized public opinion research samples. The third group in our sample — 41 studies in total (10%) — consists of public opinion research based on probability samples. These studies employ cross-sectional and longitudinal designs, often to examine general beliefs about science-related issues [e.g., Schäfer et al., 2018; Trollip et al., 2024]. One example is a study by Ho and Chuah [2022], which relies on a stratified probability sample in a face-to-face survey of 1,000 Singaporeans to examine how media exposure influences public knowledge about nuclear energy.
Randomized public opinion samples typically target the general public. The median sample size is 1,331 participants. The U.S. is the most common research context, with 18 studies (44%). Moreover, seven studies (17%) in this group are international-comparative in scope. Compared to the other groups, this sample type is less frequently found in non-WEIRD contexts, with only three cases identified (7%). All studies in this group rely on probability sampling; 13 studies (32%) use the sampling mechanism of random-digit dialling, and 12 apply systematic selection procedures (29%). Only five draw samples from sampling frames (12%). Three use mixed approaches combining, for example, random-digit dialling and systematic selection (7%). Most studies in this group rely on telephone and face-to-face interviews. Quotas are occasionally applied, primarily to balance key demographic variables. A distinctive feature of this group is a higher-than-average use of post-stratification procedures: 15 studies apply weights to adjust for sampling biases (37%).
In conclusion, randomized public opinion research samples form the most methodologically robust segment of the literature. They tend to allow for generalizable inferences and serve as important reference points in the field [cf. Brick, 2011; McEwan, 2020]. This is reflected in the high rate of secondary analyses within this group: 16 studies draw on existing data (39% compared to 7% across all studies).
Communicator samples. The fourth group in our sample — 50 studies in total (12%) — surveys communicators, such as scientists, science communicators, and journalists. These studies typically rely on cross-sectional designs and aim to explain communication behaviours, for example by examining institutional contexts or individual motivations [e.g., Bao et al., 2023; Besley et al., 2020]. An illustrative example is Kessler et al. [2022], who conducted a complete survey of 15,778 scientists in Germany, Austria, and Switzerland using publicly available email addresses to explore mental models of science communication.
Communicator samples tend to be the smallest across all sample types, with a median of just 317 participants. With 18 studies, most are conducted in the U.S. (36%). Ten adopt an international comparative perspective (20%). Research is concentrated in WEIRD contexts, with nine studies conducted elsewhere (18%). The group includes a mix of non-probability and complete samples, while a small number rely on probability sampling. Recruitment is most often based on unsolicited emails. Only one study applies quotas based on discipline and career stage, and another uses survey weights to adjust for disciplinary imbalances.
Overall, communicator studies are more likely than the other studies to aim for full samples. Given the defined target groups in these samples, external validity is important. This is reflected in reporting practices: 32 studies report response rates (64%, compared to 21% across all studies). Due to more transparent reporting and a somewhat higher number of full samples, we consider this segment as mostly robust.
Science communication audience samples. The fifth group in our sample — 20 studies in total (5%) — focuses on audiences of science communication, such as listeners of science podcasts [e.g., Fantini & Buist, 2021] or visitors to an open house event [Kato-Nitta et al., 2018]. These studies typically employ cross-sectional designs and seek to understand how science is perceived in learning environments. An example is Moormann et al. [2026], who conducted a tablet-based survey of visitors at the Berlin Museum of Natural History to investigate audience understanding of evolutionary theory.
Science communication audience samples tend to be small in size, with a median of 407 participants. Unlike other sample types, this group spans a wide range of national contexts. Five studies (25%) are based outside WEIRD contexts. Sampling in this group is overwhelmingly non-probability-based, with participants recruited using convenience sampling on-site.
The group stands out for its heterogeneity in both focus and design. However, many of the studies face challenges in accessing participants and achieving sufficient sample sizes. To address these challenges, researchers often adopt creative recruitment strategies, but these approaches are often ad hoc. As a result, while these studies offer valuable glimpses into how science communication is received, the findings are limited in their robustness.
Other samples. The remaining 35 studies (9%) fall outside the main sample types and represent a diverse set of cases. For example, they examine methodological questions [e.g., Lukić & Žeželj, 2024; Mede et al., 2026] or very specific populations, such as farmers [Dan et al., 2019]. Most rely on non-probability samples. Given their methodological and thematic heterogeneity, we do not examine these studies in greater depth.
4.2 Samples over time
To address the second research question, we examined trends in sampling procedures across the study period. We plotted the shares of studies relative to the annual volume (Figure 2) to identify potential trends in general sampling procedures (complete, probability, or non-probability samples) and recruitment methods (in person, access panel, micro-tasking platform, etc.). Moreover, we investigated how the distribution of the previously identified clusters changed over time.
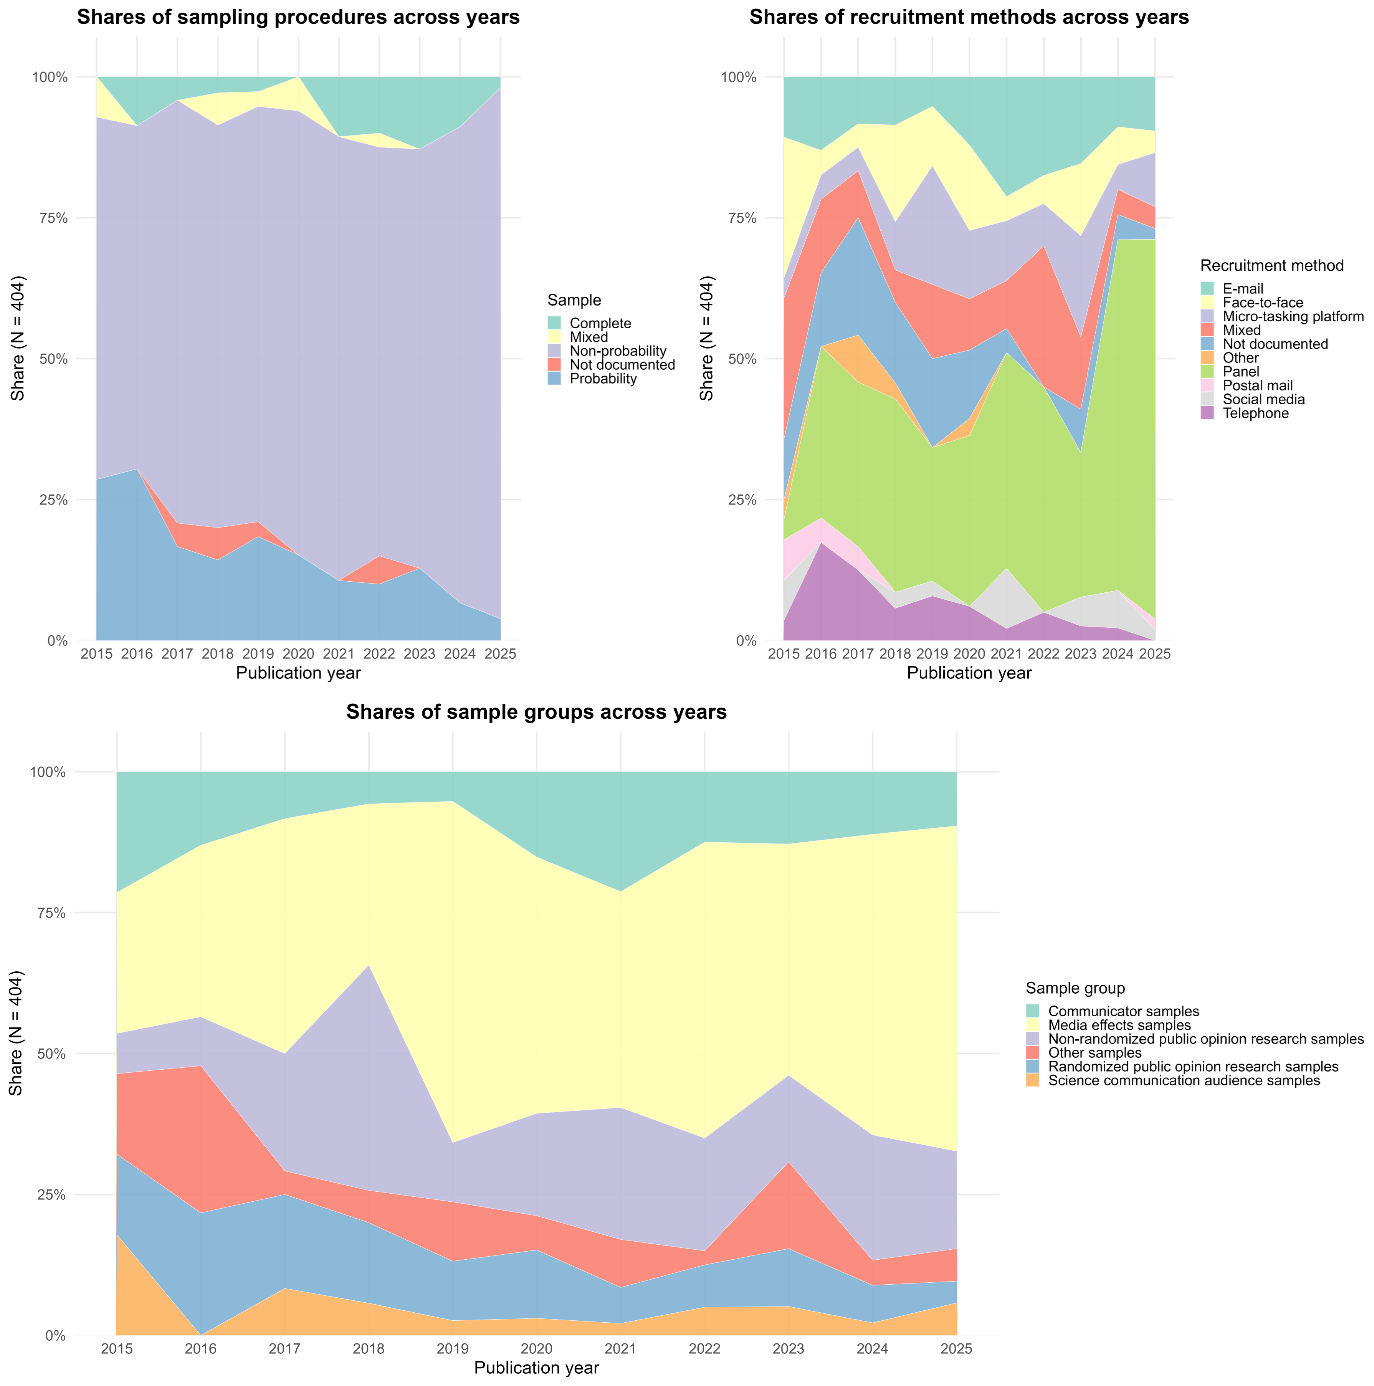
In 2015, probability samples made up 29% of the studies, while non-probability accounted for 64%. Over the following years, the use of probability samples declined, while non-probability sampling approaches became increasingly dominant. By 2025, probability samples had dropped to just 4% of all studies, whereas the share of non-probability samples rose to 94%. The use of complete samples remained relatively stable across the period, fluctuating around 6%. This shift in sampling approaches corresponds with a change in recruitment modes: in 2015, 25% of all samples were recruited face-to-face, while the use of access panels was rare, accounting for only 4%. Over time, however, face-to-face recruitment declined, while access panel-based recruitment grew. By 2025, 67% of all samples were recruited via access panels.
Looking at the distribution of sampling clusters over time, we see a clear increase in media effects samples. In 2015, studies in this group made up 25% of the total, but their share grew steadily to 57% by 2025. Similarly, non-randomized public opinion research samples also gained ground, increasing from 7% in 2015 to 17% in 2025. In contrast, randomized public opinion research samples declined, dropping from 14% to 4% over the same period. The shares of communicator samples and science communication audience samples remained relatively stable around 10%, with some fluctuations over time.
This analysis shows that priorities have shifted, with science communication researchers now relying more frequently on non-probability sampling than in the past.
4.3 Limitations discussed
To address our third research question, we examined whether science communication researchers discuss the limitations of their sampling procedures (cf. Table 4). Specifically, we looked for four common types of limitations: non-response (e.g., low response rates), self-selection (e.g., voluntary participation), selection bias (e.g., restricted sampling frames imposed by researchers), and missing or insufficient randomization of sample selection.
| Media effects | Non-randomized | Randomized | Communicators | Audiences | Other | All
| |||||||||
| n | % | n | % | n | % | n | % | n | % | n | % | n | % | ||
| Limitations | Non-response | 3 | 1.7 | 3 | 3.9 | 4 | 9.8 | 12 | 24.0 | 1 | 5.0 | 4 | 11.4 | 27 | 6.7 |
| Self-selection | 8 | 4.4 | 16 | 20.8 | 2 | 4.9 | 8 | 16.0 | 2 | 10.0 | 7 | 2.0 | 43 | 10.6 | |
| Selection bias | 45 | 24.9 | 14 | 18.2 | 1 | 2.4 | 10 | 20.0 | 4 | 2.0 | 6 | 17.1 | 80 | 19.8 | |
| Randomization | 8 | 4.4 | 10 | 13.0 | 0 | .0 | 0 | .0 | 1 | 5.0 | 3 | 8.6 | 22 | 5.4 | |
Sampling biases are addressed only by a minority of studies; 137 studies mention limitations related to sampling procedures (44%). Among the studies that discuss limitations, selection bias is the most frequently mentioned issue, followed by self-selection. Missing randomization and non-response are rarely discussed. The groups of studies differ in the extent to which they reflect on methodological limitations: only 58 media effects studies discuss limitations of the sampling procedures (32%). Authors tend to be concerned primarily with selection bias. Meanwhile, 30 non-randomized public opinion research studies reflect on the sampling procedure (39%). Several address the issues of self-selection, selection bias, and non-response. Randomized public opinion studies report the fewest limitations. Only six studies mention limitations (15%). Communicator studies show the highest transparency; 21 studies mention limitations (42%). Authors consistently address self-selection, non-response, and selection bias. Seven science communication audience studies engage with limitations (35%). Authors predominantly acknowledge the challenges of recruiting participants in opportunistic settings.
In conclusion, limitations related to sampling appear to be a secondary concern for science communication researchers.
5 Pathways for improvement
We examined empirical studies from the recent past to assess how science communication researchers approach sampling. As expected, we identified a broad spectrum of sampling procedures, reflecting the field’s diverse landscape [cf. Bucchi & Trench, 2021]. Our findings show that many science communication researchers reflect on sampling procedures; however, we also identified shortcomings. In the following, we highlight pathways that offer potential for improvement in science communication research.
We found that science communication researchers often rely on non-probability samples drawn from access panels. This trend is double-edged: on the one hand, it reflects growing budgets and efforts to gather data systematically. Access panel samples can be appropriate, especially for experimental or exploratory research [cf. Baker et al., 2013]. On the other hand, access panels are not the public; they consist of individuals whose attitudes and behaviours can differ from those of the broader population [Baker et al., 2013; cf. Brick, 2011; Erba et al., 2018].9 Moreover, we found that international comparative studies are more prone to relying on non-probability samples. This is problematic because sample biases may distort cross-country comparisons [cf. Baker et al., 2013]. Against this backdrop, we advocate for the ‘gold standard’ of public opinion research: probability sampling allows for most generalizable insights and is not yet obsolete. Nevertheless, we recognize financial constraints and acknowledge that the ‘gold standard’ is not always feasible.
The growing reliance on access panels points to another area of inquiry: we observe limited methodological innovation in sampling. For example, the absence of purposive sampling in the reviewed studies is noteworthy. We reason that the dominance of access panels might give the false impression that ‘the public’ and large sample sizes are easily accessible. However, we need innovation because science communication research faces a unique problem: to even participate in a scientific survey about science, respondents must hold at least some trust in science [cf. Cooper & Farid, 2016]. This likely skews our analyses in ways other fields don’t face, making methodological innovation not optional but necessary. More attention could be paid to alternative sampling approaches, e.g., purposive sampling or systematic probability sampling in real-world settings, to better reflect the contested nature of science-society relations [cf. Iyengar & Massey, 2018; Kelly & Westerman, 2020]. Moreover, most studies equate sample quality with large sample sizes and basic demographic quotas, but ignore attitudinal factors and sampling biases. However, one might ask: why should sample quality be judged solely by sample size, and age and gender distribution, rather than by whether participants hold varying levels of trust in science? We therefore advocate for the use of meaningful quotas in science communication research. By this, we mean applying stratification that reflects variables central to the field. Moreover, demographic variables can easily be weighted post hoc, as auxiliary information on population distributions is widely available [cf. Andridge et al., 2019; Valliant & Dever, 2011]. The same cannot be said for attitudinal variables.
Beyond methodological concerns, we identify a structural limitation: almost two-thirds of the reviewed studies were conducted in the U.S. or Germany, and only about one in ten took place outside of WEIRD contexts. For media effects samples, the imbalance is even more pronounced. Put plainly, almost everything we know about the effects of science communication in mass media comes from two national contexts. We know little about how science communication works elsewhere. Interestingly, we observed the opposite pattern for science communication audience research: samples here are notably more diverse, and the U.S. appears under-researched.
Our analysis also shows that sampling procedures are often vaguely described and seldomly planned. For example, only every fifth study reports a response rate, and almost one out of ten studies provide no information on how participants were recruited. Sometimes, even information on the national context is missing. We repeatedly encountered the claim that access panels cannot provide information on response rates. This strikes us as odd: response rates are a key performance indicator for access panel providers, and in our own research, we have been able to obtain these figures without difficulty [Post & Bienzeisler, 2024; Post et al., 2021]. We therefore advocate for greater transparency and more consistent reporting of sampling procedures.
Altogether, we propose five steps to improve sampling in science communication research: (1) consistently report sampling procedures, response rates, and sample characteristics, (2) reserve non-probability samples for experimental and exploratory studies, (3) use probability sampling when making generalizable claims, (4) foster innovation to reach diverse publics, including those less trustful in science, and (5) apply meaningful quotas, not just demographics. And last but not least, be humble about your approach.
6 Conclusion
This paper examined how science communication researchers approach sampling. We outlined methodological principles behind sampling, reviewed sampling procedures, and assessed current trends. Our findings point to areas in need of improvement, including the widespread use of non-probability samples and limited population diversity. By highlighting steps for improving sampling, we hope to support a more robust empirical foundation for science communication research.
As with any study, there are limitations. Our analysis is limited to three journals, which means we applied a restrictive sampling frame ourselves. As a result, generalizing beyond these outlets remains difficult. Moreover, we relied on reported information, which may have omitted informal practices or undocumented decisions. Finally, because of the volume of literature, we could not examine every detail. Nonetheless, we are confident that our review captures the main trends in science communication research.
Our paper aligns with an emerging body of work that reflects on methods in science communication research [e.g., Cooper & Farid, 2016; Mede et al., 2026; Xenos et al., 2025]. As the field of science communication research continues to grow, what is missing in our view is work on methodology; in plain terms, we still lack a coherent method of science communication research. We therefore call for efforts to strengthen the field’s empirical standards and conceptual clarity, for example, through special issues, conferences, and targeted research proposals.
Funding
This review received no financial support.
Competing interests
The authors declare no competing interests.
Data and instrument availability
The code book and data are available at osf.io.
Use of AI
We utilized ChatGPT 4.0 for language editing (for example, “Review the following paragraph for
grammar, clarity, and style. Highlight awkward sentences or unclear meanings and
suggest improvements.” or “Smoothen!”). All content generated was reviewed and
verified.
References
-
Andridge, R. R., West, B. T., Little, R. J. A., Boonstra, P. S., & Alvarado-Leiton, F. (2019). Indices of non-ignorable selection bias for proportions estimated from non-probability samples. Journal of the Royal Statistical Society. Series C: Applied Statistics, 68(5), 1465–1483. https://doi.org/10.1111/rssc.12371
-
Baker, R., Brick, J. M., Bates, N. A., Battaglia, M., Couper, M. P., Dever, J. A., Gile, K. J., & Tourangeau, R. (2013). Summary report of the AAPOR task force on non-probability sampling. Journal of Survey Statistics and Methodology, 1(2), 90–143. https://doi.org/10.1093/jssam/smt008
-
Bao, L., Calice, M. N., Brossard, D., Beets, B., Scheufele, D. A., & Rose, K. M. (2023). How institutional factors at US land-grant universities impact scientists’ public scholarship. Public Understanding of Science, 32(2), 124–142. https://doi.org/10.1177/09636625221094413
-
Besley, J. C., Newman, T. P., Dudo, A., & Tiffany, L. A. (2020). Exploring scholars’ public engagement goals in Canada and the United States. Public Understanding of Science, 29(8), 855–867. https://doi.org/10.1177/0963662520950671
-
Bienzeisler, N. (2026). Of issue advocates and honest brokers: participation of U.S. and German scientists in COVID-19 policy disputes. Public Understanding of Science, 35(2), 177–196. https://doi.org/10.1177/09636625251371565
-
Brick, J. M. (2011). The future of survey sampling. Public Opinion Quarterly, 75(5), 872–888. https://doi.org/10.1093/poq/nfr045
-
Bucchi, M., & Trench, B. (2021). Science communication as the social conversation around science. In M. Bucchi & B. Trench (Eds.), Routledge handbook of public communication of science and technology (3rd ed., pp. 1–13). Routledge. https://doi.org/10.4324/9781003039242
-
Butler, A. E., Copnell, B., & Hall, H. (2018). The development of theoretical sampling in practice. Collegian, 25(5), 561–566. https://doi.org/10.1016/j.colegn.2018.01.002
-
Chang, J.-H., Kim, S.-H., Kang, M.-H., Shim, J. C., & Ma, D. H. (2018). The gap in scientific knowledge and role of science communication in South Korea. Public Understanding of Science, 27(5), 578–593. https://doi.org/10.1177/0963662516685487
-
Cologna, V., Mede, N. G., Berger, S., Besley, J., Brick, C., Joubert, M., Maibach, E. W., Mihelj, S., Oreskes, N., Schäfer, M. S., van der Linden, S., Abdul Aziz, N. I., Abdulsalam, S., Shamsi, N. A., Aczel, B., Adinugroho, I., Alabrese, E., Aldoh, A., Alfano, M., … Zwaan, R. A. (2025). Trust in scientists and their role in society across 68 countries. Nature Human Behaviour, 9(4), 713–730. https://doi.org/10.1038/s41562-024-02090-5
-
Cooper, E. A., & Farid, H. (2016). Does the Sun revolve around the Earth? A comparison between the general public and online survey respondents in basic scientific knowledge. Public Understanding of Science, 25(2), 146–153. https://doi.org/10.1177/0963662514554354
-
Corbin, J., & Strauss, A. (2008). Basics of qualitative research: techniques and procedures for developing grounded theory (3rd ed.). SAGE Publications. https://doi.org/10.4135/9781452230153
-
Cumming, R. G. (1990). Is probability sampling always better? A comparison of results from a quota and a probability sample survey. Community Health Studies, 14(2), 132–137. https://doi.org/10.1111/j.1753-6405.1990.tb00033.x
-
Dan, V., Osterheider, A., & Raupp, J. (2019). The diffusion of innovations in agricultural circles: an explorative study on alternative antimicrobial agents. Science Communication, 41(1), 3–37. https://doi.org/10.1177/1075547018819159
-
Erba, J., Ternes, B., Bobkowski, P., Logan, T., & Liu, Y. (2018). Sampling methods and sample populations in quantitative mass communication research studies: a 15-year census of six journals. Communication Research Reports, 35(1), 42–47. https://doi.org/10.1080/08824096.2017.1362632
-
Fantini, E., & Buist, E. (2021). Searching for the Sources of the Nile through a podcast: what did we find? JCOM, 20(02), N01. https://doi.org/10.22323/2.20020801
-
Field, A. P., Miles, J., & Field, Z. (2012). Discovering statistics using R. SAGE Publications.
-
Fogg-Rogers, L., Bay, J. L., Burgess, H., & Purdy, S. C. (2015). “Knowledge is power”: a mixed-methods study exploring adult audience preferences for engagement and learning formats over 3 years of a health science festival. Science Communication, 37(4), 419–451. https://doi.org/10.1177/1075547015585006
-
Fung, T. K. F., Leung, H. M., Zhou, X., & Zheng, S. (2026). “What might happen with generative AI?” Examining the role of prefactual thinking in the cognitive mediation model in the context of emerging technologies. Science Communication, 48(3), 367–401. https://doi.org/10.1177/10755470251362368
-
Fürst, S., Volk, S. C., Schäfer, M. S., Vogler, D., & Sörensen, I. (2022). Organizational and societal goals in tension? A survey of communication practitioners at Swiss higher education institutions. JCOM, 21(07), A06. https://doi.org/10.22323/2.21070206
-
Guenther, L., & Ruhrmann, G. (2016). Scientific evidence and mass media: investigating the journalistic intention to represent scientific uncertainty. Public Understanding of Science, 25(8), 927–943. https://doi.org/10.1177/0963662515625479
-
Gustafson, A., Goldberg, M. H., Lee, S., Remshard, M., Luttrell, A., Rosenthal, S. A., & Leiserowitz, A. (2025). Testing the durability of persuasion from moral appeals about renewable energy. Science Communication, 47(6), 800–827. https://doi.org/10.1177/10755470241311011
-
Haddaway, N. R., Page, M. J., Pritchard, C. C., & McGuinness, L. A. (2022). PRISMA2020: an R package and Shiny app for producing PRISMA 2020-compliant flow diagrams, with interactivity for optimised digital transparency and Open Synthesis. Campbell Systematic Reviews, 18(2), e1230. https://doi.org/10.1002/cl2.1230
-
Hendriks, F., Kienhues, D., & Bromme, R. (2016). Evoking vigilance: would you (dis)trust a scientist who discusses ethical implications of research in a science blog? Public Understanding of Science, 25(8), 992–1008. https://doi.org/10.1177/0963662516646048
-
Ho, S. S., & Chuah, A. S. F. (2022). Thinking, not talking, predicts knowledge level: effects of media attention and reflective integration on public knowledge of nuclear energy. Public Understanding of Science, 31(5), 572–589. https://doi.org/10.1177/09636625211070786
-
Humm, C., Schrögel, P., & Leßmöllmann, A. (2020). Feeling left out: underserved audiences in science communication. Media and Communication, 8(1), 164–176. https://doi.org/10.17645/mac.v8i1.2480
-
Iyengar, S., & Massey, D. S. (2018). Scientific communication in a post-truth society. Proceedings of the National Academy of Sciences, 116(16), 7656–7661. https://doi.org/10.1073/pnas.1805868115
-
Kato-Nitta, N., Maeda, T., Iwahashi, K., & Tachikawa, M. (2018). Understanding the public, the visitors, and the participants in science communication activities. Public Understanding of Science, 27(7), 857–875. https://doi.org/10.1177/0963662517723258
-
Kelly, S., & Westerman, D. (2020). Doing communication science: thoughts on making more valid claims. Annals of the International Communication Association, 44(3), 177–184. https://doi.org/10.1080/23808985.2020.1792789
-
Kennedy, C., Mercer, A., Keeter, S., Hatley, N., McGeeney, K., & Gimenez, A. (2016). Evaluating online nonprobability surveys. Pew Research Center. https://www.pewresearch.org/methods/2016/05/02/evaluating-online-nonprobability-surveys/
-
Kessler, S. H., Schäfer, M. S., Johann, D., & Rauhut, H. (2022). Mapping mental models of science communication: how academics in Germany, Austria and Switzerland understand and practice science communication. Public Understanding of Science, 31(6), 711–731. https://doi.org/10.1177/09636625211065743
-
Kish, L. (1969). Survey sampling. Wiley.
-
Klinger, K., Metag, J., Schäfer, M. S., Füchslin, T., & Mede, N. (2022). Are science communication audiences becoming more critical? Reconstructing migration between audience segments based on Swiss panel data. Public Understanding of Science, 31(5), 553–562. https://doi.org/10.1177/09636625211057379
-
Koch, C., Saner, M., Schäfer, M. S., Herrmann-Giovanelli, I., & Metag, J. (2020). “Space means Science, unless it’s about Star Wars”: a qualitative assessment of science communication audience segments. Public Understanding of Science, 29(2), 157–175. https://doi.org/10.1177/0963662519881938
-
Lowry, D. T. (1979). Population validity of communication research: sampling the samples. Journalism Quarterly, 56(1), 62–76. https://doi.org/10.1177/107769907905600110
-
Lukić, P., & Žeželj, I. (2024). Delineating between scientism and science enthusiasm: challenges in measuring scientism and the development of novel scale. Public Understanding of Science, 33(5), 568–586. https://doi.org/10.1177/09636625231217900
-
McEwan, B. (2020). Sampling and validity. Annals of the International Communication Association, 44(3), 235–247. https://doi.org/10.1080/23808985.2020.1792793
-
Mede, N. G., Howell, E. L., Schäfer, M. S., Metag, J., Beets, B., & Brossard, D. (2026). Measuring science literacy in a digital world: development and validation of a multi-dimensional survey scale. Science Communication, 48(1), 93–127. https://doi.org/10.1177/10755470251317379
-
Mercer, A., & Lau, A. (2023). Comparing two types of online survey samples. Pew Research Center. https://www.pewresearch.org/methods/2023/09/07/comparing-two-types-of-online-survey-samples/
-
Moormann, A., Beniermann, A., & Fiedler, D. (2026). Natural history museum visitors’ use of key concepts and misconceptions in written explanations of evolutionary scenarios. Public Understanding of Science, 35(1), 100–117. https://doi.org/10.1177/09636625251355890
-
Neyman, J. (1934). On the two different aspects of the representative method: the method of stratified sampling and the method of purposive selection. Journal of the Royal Statistical Society, 97(4), 558–625. https://doi.org/10.2307/2342192
-
Page, M. J., McKenzie, J. E., Bossuyt, P. M., Boutron, I., Hoffmann, T. C., Mulrow, C. D., Shamseer, L., Tetzlaff, J. M., Akl, E. A., Brennan, S. E., Chou, R., Glanville, J., Grimshaw, J. M., Hróbjartsson, A., Lalu, M. M., Li, T., Loder, E. W., Mayo-Wilson, E., McDonald, S., … Moher, D. (2021). The PRISMA 2020 statement: an updated guideline for reporting systematic reviews. BMJ, 372, n71. https://doi.org/10.1136/bmj.n71
-
Patton, M. Q. (2003). Qualitative research & evaluation methods (3rd ed.). SAGE Publications.
-
Post, S., & Bienzeisler, N. (2024). The honest broker versus the epistocrat: attenuating distrust in science by disentangling science from politics. Political Communication, 41(5), 763–785. https://doi.org/10.1080/10584609.2024.2317274
-
Post, S., Bienzeisler, N., & Lohöfener, M. (2021). A desire for authoritative science? How citizens’ informational needs and epistemic beliefs shaped their views of science, news, and policymaking in the COVID-19 pandemic. Public Understanding of Science, 30(5), 496–514. https://doi.org/10.1177/09636625211005334
-
Saumure, K., & Given, L. M. (2008). Convenience sample. In L. M. Given (Ed.), The SAGE encyclopedia of qualitative research methods. SAGE Publications. https://doi.org/10.4135/9781412963909.n68
-
Schäfer, M. S., Füchslin, T., Casutt, G.-A., Suggs, S., Aberer, K., Burkard, P., Godinho, A., Hirschi, C., Jacobs, A., Jarren, O., Kaufmann, A., Knutti, R., Maier, M., Metag, J., Müller, T., Strasser, B., & Weichselbraun, A. (2021). Science in the Swiss public. The state of science communication and public engagement with science in Switzerland. Swiss Academies of Arts and Sciences. https://doi.org/10.5281/zenodo.4974311
-
Schäfer, M. S., Füchslin, T., Metag, J., Kristiansen, S., & Rauchfleisch, A. (2018). The different audiences of science communication: a segmentation analysis of the Swiss population’s perceptions of science and their information and media use patterns. Public Understanding of Science, 27(7), 836–856. https://doi.org/10.1177/0963662517752886
-
Schug, M., Bilandzic, H., & Kinnebrock, S. (2024). Public perceptions of trustworthiness and authenticity towards scientists in controversial scientific fields. JCOM, 23(09), A03. https://doi.org/10.22323/2.23090203
-
Shauli, S., & Baram-Tsabari, A. (2019). The usefulness of science knowledge for parents of hearing-impaired children. Public Understanding of Science, 28(1), 19–37. https://doi.org/10.1177/0963662518772503
-
Smith, T. M. F. (1983). On the validity of inferences from non-random sample. Journal of the Royal Statistical Society. Series A (General), 146(4), 394–403. https://doi.org/10.2307/2981454
-
Trollip, K., Gastrow, M., Ramlagan, S., & Shean, Y. (2024). Harnessing multimodal and multilingual science communication to combat misinformation in a diverse country setting. JCOM, 23(09), N01. https://doi.org/10.22323/2.23090801
-
Valentino, N. A., Zhirkov, K., Hillygus, D. S., & Guay, B. (2020). The consequences of personality biases in online panels for measuring public opinion. Public Opinion Quarterly, 84(2), 446–468. https://doi.org/10.1093/poq/nfaa026
-
Valliant, R., & Dever, J. A. (2011). Estimating propensity adjustments for volunteer web surveys. Sociological Methods & Research, 40(1), 105–137. https://doi.org/10.1177/0049124110392533
-
Wonneberger, A., Meijers, M. H. C., & Schuck, A. R. T. (2020). Shifting public engagement: how media coverage of climate change conferences affects climate change audience segments. Public Understanding of Science, 29(2), 176–193. https://doi.org/10.1177/0963662519886474
-
Xenos, M. A., Chinn, S., & Monroe, H. (2025). Balancing relevance and rigor: analyzing a quarter century of issue-case selection in science communication research. Public Understanding of Science, 34(6), 700–716. https://doi.org/10.1177/09636625251330197
-
Yang, K., & Banamah, A. (2014). Quota sampling as an alternative to probability sampling? An experimental study. Sociological Research Online, 19(1), 56–66. https://doi.org/10.5153/sro.3199
Notes
1. Please note the potential double meaning of the term panel: it can refer to a respondent pool or to a longitudinal survey with repeated waves. We use the former and speak of access panels.
2. Some commercial access panels are built on probability-based sampling and designed to reflect, for example, the United States population. However, such access panels are rare, costly, and not typical for most access panel-based research. Moreover, some biases are consistent across all online samples, for example, the overrepresentation of politically engaged citizens [Kennedy et al., 2016].
3. The review was neither reregistered, nor did we prepare a study protocol.
4. We selected the period 2015–2025 because science communication research expanded substantially during these years and the time frame captures both the years before and after the COVID-19 pandemic.
5. We searched for the keywords “survey”, “questionnaire”, “interview”, “experiment”, and “poll” in the titles and abstracts of all articles published between 2015 and October 1st 2025. We collected data only until October 2025, due to the high number of online-first articles.
6. In cases of uncertainty, authors discussed and decided collectively.
7. An AI-based summarization tool was used to assist reviewers in checking the coding. All automated outputs were reviewed.
8. We first read all papers. We coded each paper and summarized them. Next, we assigned keywords to the summaries. Studies were then organized using a tabular overview sorted by research design and key words. In a final step, we assigned each paper to one of the groups. In cases of uncertainty regarding group allocation, study abstracts were consulted. Subsequently, we used R to visualize the shares of the identified approaches in relation to the overall volume of the literature.
9. What is more, science communication researchers also tend to advertise their research as “representative”, a controversial term that loosely means a sample reflects the characteristics of a population [cf. Lowry, 1979]. We coded whether science communication researchers claimed to use representative samples (without explicit hedging, Krippendorff’s α = .89) and whether these claims were overstated (Krippendorff’s α = .79). Out of the 404 studies, 96 claim to be representative (24%), mostly because they adhere to basic demographic quotas, such as age and gender. While we could confirm this claim for 33 studies, in 63 cases we were skeptical [based on the suggestions of AAPOR, cf. Baker et al., 2013], as the studies used non-probability samples, reported low response rates, or did not document their approach.
About the authors
Nils Bienzeisler is a postdoctoral researcher at the IPN — Leibniz Institute for Science and Mathematics Education in Kiel, Germany. His research focuses on the role of science in policy disputes, science-policy interactions, and media effects. Once upon a time, he worked for an online access panel, where he first developed an interest in sampling. He absolutely loves cats.
E-mail: nils-bienzeisler@t-online.de
Yael Barel-Ben David is a Minerva postdoctoral fellow and Head of the Training pillar at the Kiel Science Communication Network (KSCN), Kiel University (CAU), and IPN — Leibniz Institute for Science and Mathematics Education in Kiel, Germany. Her work combines research and practice to investigate how innovative science communication strategies, including the use of GenAI, can bridge the gap between scientists’ engagement efforts and publics’ practical application, thereby promoting effective science communication and supporting evidence-based decision-making among publics.
E-mail: barel-ben_david@leibniz-ipn.de
Melanie Keller is a Professor of Physics Education at the IPN — Leibniz Institute for Science and Mathematics Education in Kiel, Germany. Her research lies at the intersection of science education and science communication and focuses on emotional processes — how they arise, what shapes them, and how they influence how audiences perceive, seek, interpret, and use scientific information.
E-mail: keller@leibniz-ipn.de
Supplementary material
Available at https://doi.org/10.22323/373520260403044443
Table 1: Overview
Table 2: Papers analyzed
Table 4: PRISMA checklist