
1 Introduction
Many national governments believe that increasing the number of people working in science, technology, engineering, and mathematics (STEM) sectors is important to their development and future economic growth [e.g., Australian Government, 2017 ; Scottish Government, 2020 ; Office of Science And Technology Policy, 2020 ]. There is also a recognition that many STEM sectors, particularly physical sciences, engineering and technology, have limited diversity of employees [ Engineering UK, 2018 ]. As such, encouraging more young people from a more diverse range of backgrounds, to enter careers in these sectors has been a key part of education policy in several jurisdictions [ Department for Education, 2017 ; Welsh Government, 2016 ]. Science communication, particularly in the form of school-focused STEM engagement activity, has seen heavy investment as one way to encourage more young people to enter STEM fields [ National Audit Office, 2018 ].
There is a correlation between a young person’s stated intention to study STEM subjects, and their ‘science capital’: science-related factors and behaviours within their families [ Archer, Dawson, DeWitt, Seakins & Wong, 2015 ] consisting of:
scientific literacy, scientific-related dimensions/preferences (e.g. attitudes to science and scientists, perceptions of school science and teachers), knowledge about the transferability of science qualifications (in the labour market), consumption of science-related media, participation in out-of-school science learning activities, and science-related social capital (i.e. knowing individuals working in science-related jobs, talking with others about science) [ DeWitt, Archer & Mau, 2016 , pp. 2436].
Calculation of a science capital “score” based on these dimensions showed a correlation between “high” science capital and young people with predominantly male, white/asian and socially advantaged backgrounds [Archer et al., 2015 ]. Consequently, this led to stronger focus on interventions which ‘build science capital’ in children and young people, particularly in those groups traditionally under-represented in science, as a way of increasing participation and diversity within the STEM sector [see e.g., BP, 2021 ; Excell, 2019 ]. This includes the development of STEM engagement activities designed to target one or more of the dimensions of science capital e.g., the STEM Ambassador programme in UK aims to increase the number of young people who know (or who at least have met) individuals working in science related jobs [ STEM Learning, 2016 ].
A different approach to broadening the appeal of STEM subjects, and consequently the diversity of those choosing to study and work in STEM sectors, has been to develop science communication and STEM engagement programmes which include aspects of design and creativity. This approach is often denoted as STEAM (science, technology, engineering, arts, mathematics). Proponents of this approach claim that participation in arts is correlated with performance in STEM fields [ Rabalais, 2014 ] and promotes students’ ability to solve problems and their self-motivation [ Land, 2013 ]. However, the use of the term can be problematic because, in the literature and in practice, it is often very broadly or poorly defined [ Mejias et al., 2021 ]. Exactly what the ‘A’ represents varies between projects and may include visual arts, design, English language, and social studies [ Quigley, Herro & Jamil, 2017 ; Colucci-Gray et al., 2017 ]. Perignat and Katz-Buonincontro [ 2019 ] identified two main approaches to defining the purpose of STEAM pedagogy: targeting under-represented groups to increase their interest in STEM skills and careers; developing problem-solving or creativity skills and different ways of knowing, with many projects focusing on the former rather than the latter. This focus on STEM skills and careers highlights another drawback with some STEAM projects: the Arts are not valued in their own right, and are often used ornamentally and as an adjunct to participation in STEM [ Clapp, Solis, Ho & Sachdeva, 2019 ]. This downplays the contribution of arts and culture to society in their own right, which is often considerable. For example, in 2011 the UK arts and cultural industry generated a turnover of £12.4 billion and provided 0.45% of total employment in the UK, and participation in arts and culture are considered instrumental in social cohesion and health [ Blackburn, Harris, Mowlah & Niblett, 2014 ].
Different approaches to STEAM can be situated within a two-axis conceptual model developed to facilitate implementation of a rounded STEAM pedagogy (Figure 1 ) [Mejias et al., 2021 ]. The Instrumental axis relates to how the different disciplines are used in relation to each other, from One-sided Instrumental where one discipline is used only to convey ideas about the other discipline to Mutually Instrumental where the practices and principles from both disciplines are valued and build on each other. The pedagogical axis relates to the purposes, or outcomes, from centering learning to there being no explicit focus on learning.
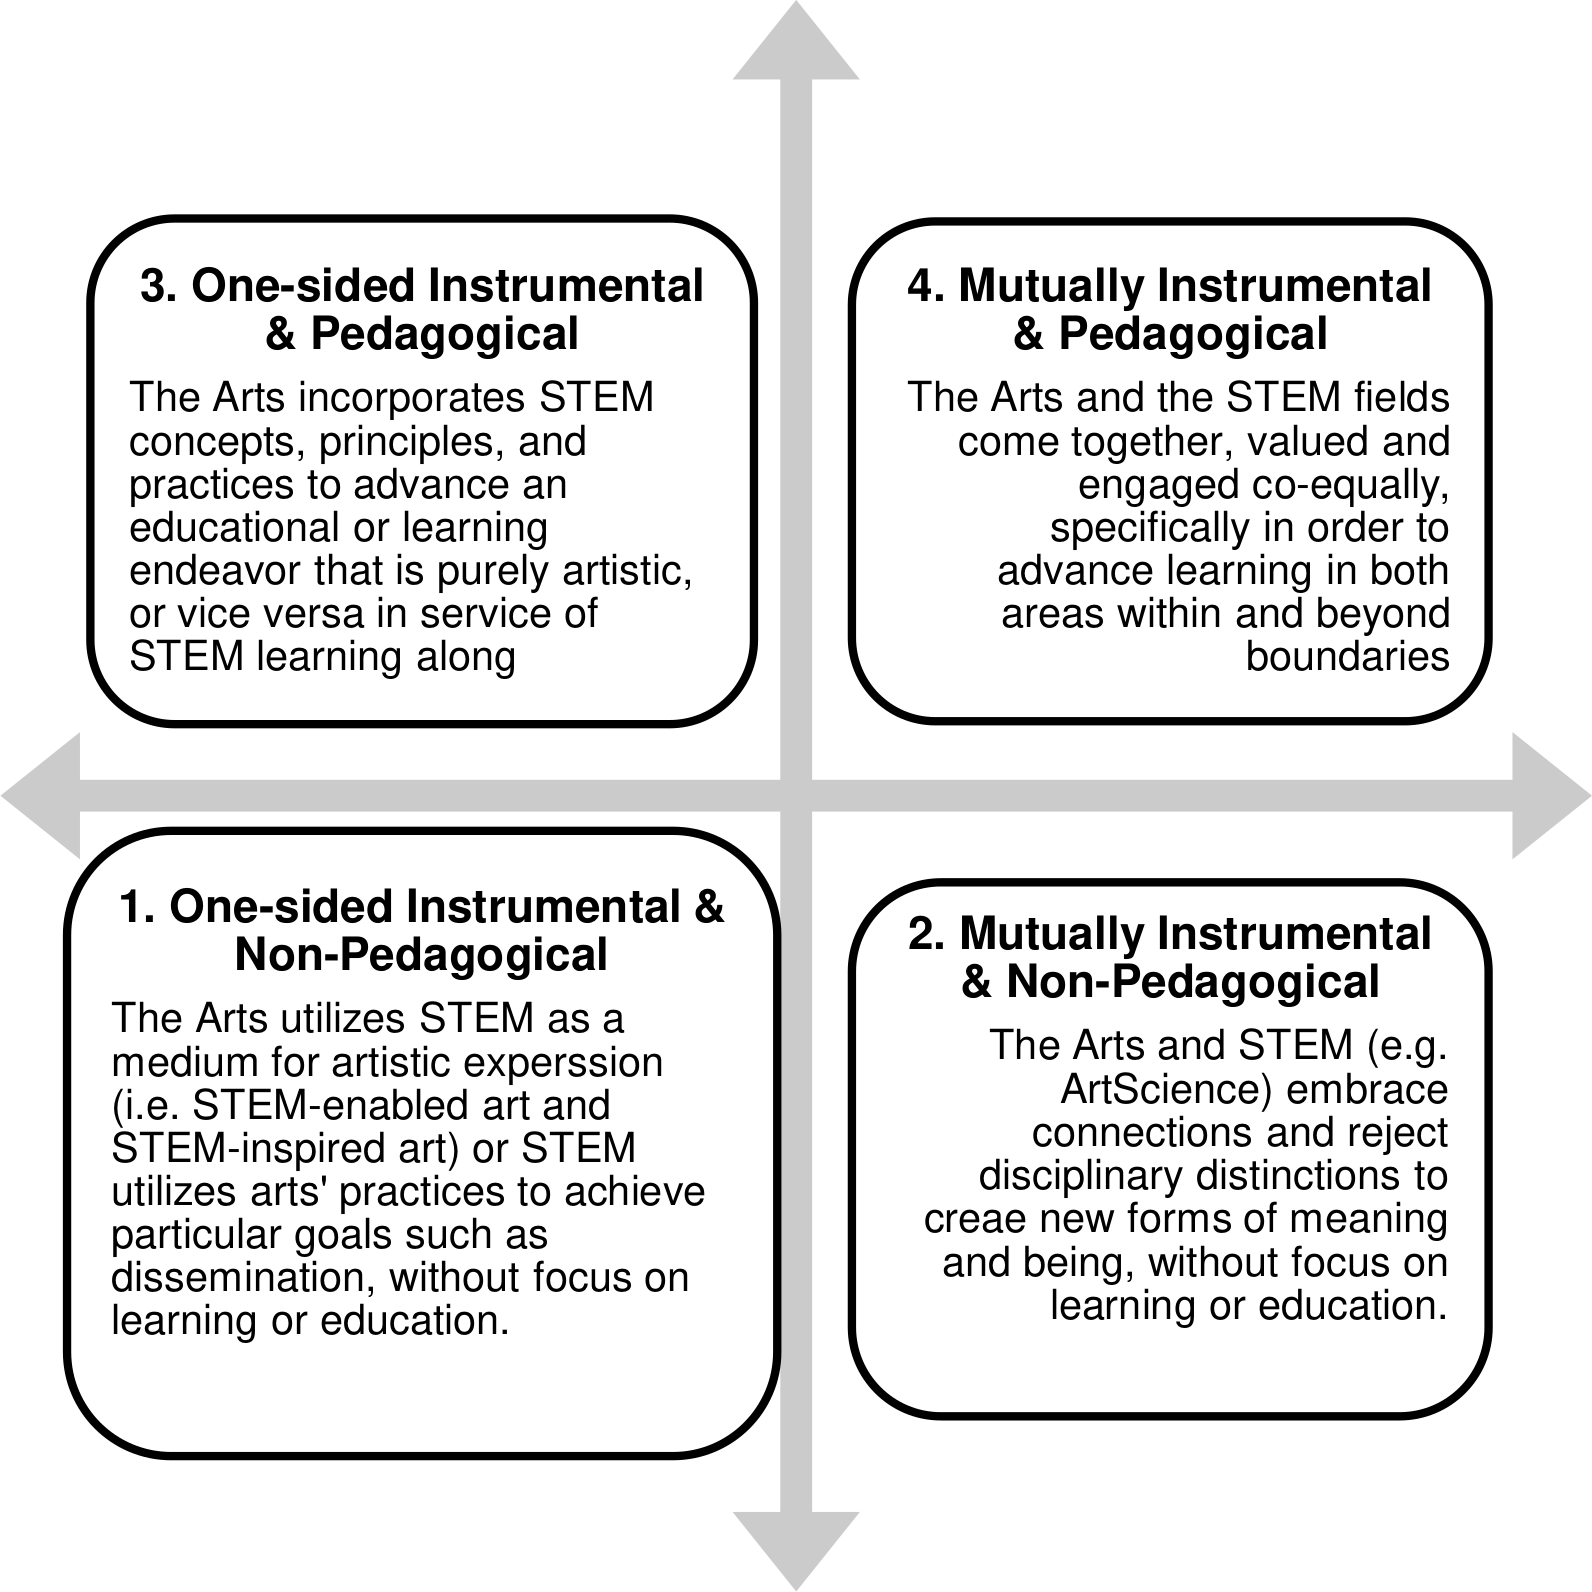
The two main approaches to STEAM projects identified by Perignat and Katz-Buonincontro [ 2019 ] sit in different quadrants of the model. Those projects which are aimed primarily at promoting STEM skills and careers using arts (however that is defined) would sit within quadrant 3 — One-sided Instrumental & Pedagogical. Projects intended to develop problem-solving skills and creativity would likely straddle quadrants 2 and 4 depending on their exact pedagogical focus.
Evaluation of science communication and engagement activities is important: to show value for money in the use of public funds [ National Audit Office, 2018 ]; to identify whether the activity is achieving the impact it was intended to have [ Jensen, 2014 ]; and to allow improvements in practice to be made [ King, Steiner, Hobson, Robinson & Clipson, 2015 ]. However, the quality of evaluation of science communication and engagement activities can be low with a lack of strategic planning, vaguely targeted interventions and poor design. [ Ziegler, Hedder & Fischer, 2021 ; Jensen, 2014 ; Morgan & Kirby, 2016 ]. This quality of evaluation may arise from lack of training for researchers who wish to take part in science communication [ Davies, 2013 ]. In the physical sciences researchers may not have a background in qualitative methods that would support appropriate evaluations to be developed [ Fischhoff, 2019 ]. Furthermore, there is ‘a persistent framing of evaluations as “telling success stories” …Therefore, failed attempts or mediocre results, which could still stimulate learning, are not disclosed.’ [Ziegler et al., 2021 , p. 4].
MacPhail and Kinchin [ 2004 ] identify several strengths of using drawings as part of an evaluation method, including being a quick and efficient way to elicit information, and providing children with their own retrieval cues, allowing children to choose their own frame of reference for the response, and reducing the effect of poor literacy skills. However, they also identify that using drawings limits responses only to those things that can be drawn, and is limited by the artistic abilities of the child. Providing the opportunity for children to choose their preferred method of response thus allows them to respond in a way they found most comfortable.
Recent work using drawings as a method to evaluate children’s increase in knowledge and understanding used comparative judgement where children’s drawings are compared before and afterwards to identify changes in knowledge [ Anjos, Aibeo & Carvalho, 2019 ]. However, comparative methods are generally time consuming to analyse, particularly for researchers who do not have a background in qualitative methods, and who must be trained in the analysis, along with standardization of judgements. This limits the data that can be included in the analysis.
This paper therefore presents a novel online comparative judgement method which removes the need for extensive training or knowledge of qualitative methods, and thus suggests affordances for those involved in the delivery and evaluation of science communication and engagement activities.
2 Objective
The Imagining the Sun project was a collaboration between three arts practitioners (visual artist Helen Schell, poet Katrina Porteous, and composer Peter Zinovieff), an outreach group and solar physics researchers at a university in the North East of England. This paper reports on one aspect of the project: a cross-curricular school intervention which brought together solar physics and visual art for children (ages 8–11).
For the purposes of this article the research questions are:
RQ1 What are the affordances of using online comparative judgement to judge the scientific content of children’s drawings?
RQ2 Does taking part in a science-art intervention increase children’s knowledge about solar science?
3 Methods
3.1 Intervention structure
Conceptually, the Imagining the Sun project sits within quadrant 4 of Figure 1 with art and science being equally valued by the project team and participants. Whilst the project team prefer to use the phrase ‘cross-curricular’ to describe the relationship between the disciplines, the project could also be considered a STEAM project with a focus on developing creativity and with the intention that participants would appreciate that art and science brought different ways of knowing the world [ McDougall, Bevan & Semper, 2012 ; Pickstone, 2011 ]. The intervention also draws on two aspects of science capital. The first was to introduce children to role models who work in science and the second was to provoke conversations about science between children and their peers, teachers and families. These aspects of science capital are included in a Theory of Change [ Davenport et al., 2020 ] which helped to shape the intervention design.
The Imagining the Sun school intervention was a split-time workshop which consisted of two separate two-hour sessions which took place in-school one to two weeks apart. The intervention was developed collaboratively by a team consisting of the visual artist, solar physics researchers and a university outreach group. Prior to creating the intervention, the artist and the solar physics researchers took part in a research symposium during which they all described their work and practice. In this way both scientists and artists involved in the wider project developed an understanding of the ways of knowing in the other disciplines. The project team then worked together to create an intervention which allowed art and science to be mutually instrumental.
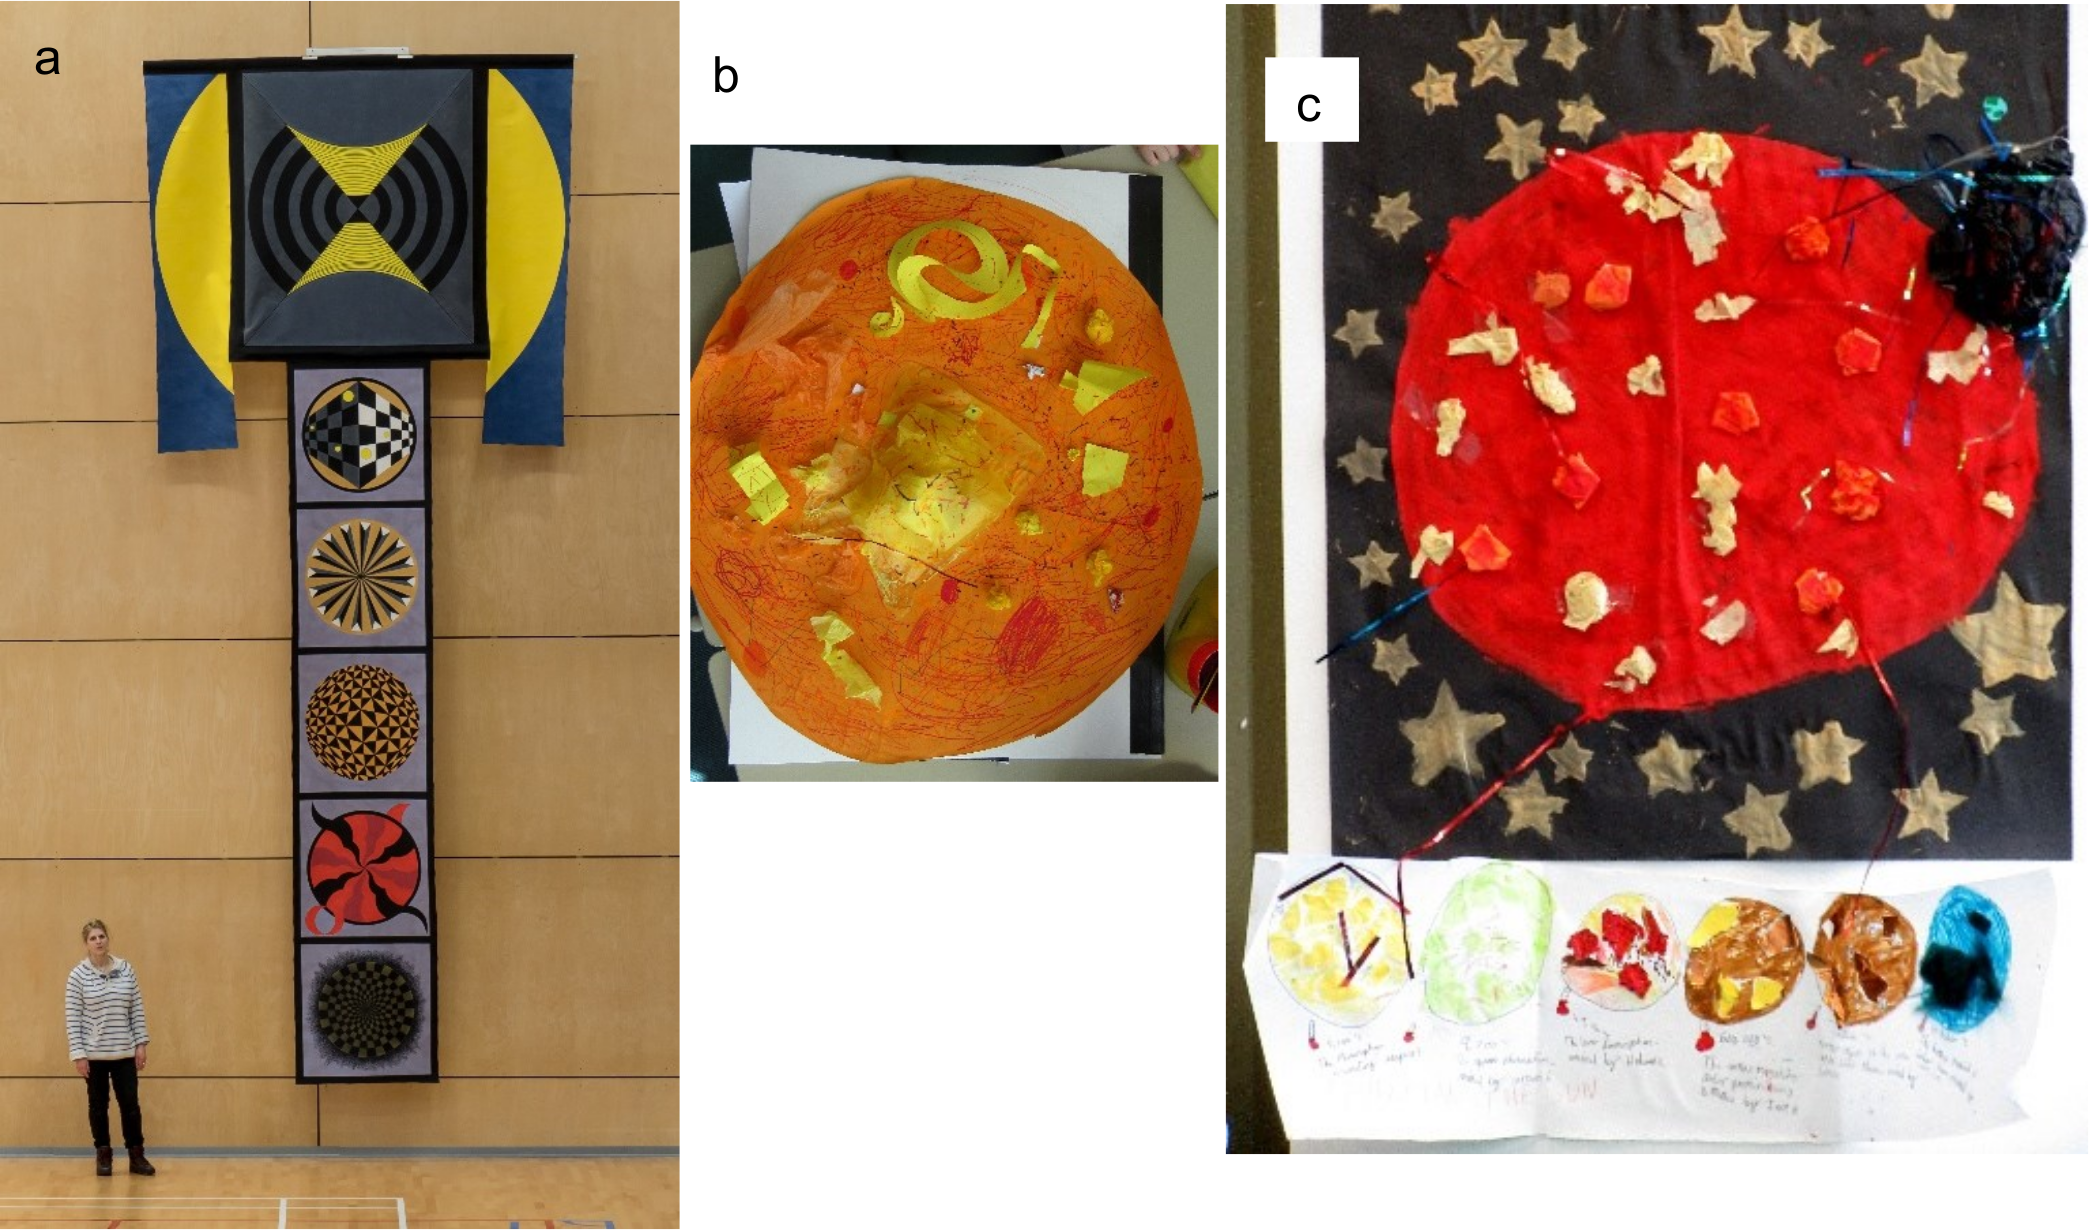
In the first session, pupils were introduced to a solar physicist who taught them about the Sun, its layers, and how we can use light to find out about the composition of the Sun. Direct instruction [ Magliaro, Lockee & Burton, 2005 ] was used to convey new information, but it was combined with a constructivist approach by regularly interspersing interactive activities to allow pupils to create their own learning using this new information [ Schunk, 2012 ]. The visual artist then discussed with the pupils how she had used the information about the Sun gained from the research symposium to create her own artwork — SOLAR (see Figure 2 a) — which expressed the layered nature of the Sun — and modelled some simple paper-art techniques. To complete the first session, pupils then created their own art work which conveyed information about the Sun and demonstrated the art techniques they had learned. The structure of the session was such that the pupils’ experience of the workshop mirrored the process of learning and exploration previously undertaken by the project team.
In the second, artist-led, session pupils were introduced to more art works created in response to solar physics and then provided with a brief to create a collaborative piece of art. This took the form of a Floorbook containing large pages (approximately 420 mm 594 mm) sewn together in a book form [ Warden, 2015 ]. To create the floorbook children worked collaboratively in small groups, and as a whole class, to express and incorporate their understanding of solar physics and art (see Figure 2 b and 2c for two such pages). A solar physics postgraduate student supported the pupils with their scientific knowledge, helping them to recall what they learnt in the first session, and answering any additional questions.
3.2 Participants
The participants consisted of 89 pupils (aged 8–11) from three primary schools in the North East of England already partnered with the outreach group. In each case, whole classes took part in the intervention as part of the standard school day. Evaluation data are presented from 40 pupils (24 girls, 15 boys, 1 unknown) from two of the participating primary schools.
3.3 Evaluation approach
The evaluation utilized a mixed methods approach and drew on the cross-curricular nature of the intervention. It was designed to allow pupils to bring science knowledge and artistic skills into their responses, as well as to explore some aspects of their science capital. A pre- and post-intervention survey model was used The pre-intervention survey was administered by the classroom teacher in the week before the first session. To promote anonymity of the children, the classroom teacher allocated an ID number between 1 and 30 to each child, and this number was used to identify the child in the pre- and post-intervention surveys.
In the survey, pupils (aged 8–11) were asked to ‘Write or draw what the Sun makes you think about.’ Pupils were then able to freely draw (or write) their answer to the question prompt. In addition to the drawings, pupils were also asked some demographic information, and questions related to dimensions of science and cultural capital: their liking of science and art, perceived ability in science and art, desire for a science career, and cultural venues that they had visited with their family. Some of these questions utilized a Likert scale which included descriptive words and pictures to facilitate children’s ability to answer the questions, and support children with lower levels of literacy [ Reynolds-Keefer & Johnson, 2011 ]. There has been some suggestion that young children may not utilize the full range of the scale when presented with icons of different frown/smiles due to differences in interpretation [ Hall, Hume & Tazzyman, 2016 ], however, previous practice by the research team has not identified this as an issue.
Post-intervention surveys were also administered by the classroom teacher approximately two weeks after the second session of the intervention. Two questions relating to dimensions of science capital were repeated to allow for comparison: How much do you like science? and How much would you like to have a job which used science?
3.4 Analysing free-response drawings
The drawings and text by the pupils from the pre- and post-intervention surveys provide a qualitative indication of potential changes in what they thought about the Sun, and hence their scientific knowledge. Initial analysis of the broad content of each response (contains science imagery/words, contains holiday imagery/words) was carried out. This enabled simple descriptive statistics of the overall change in content from each pupil to be obtained. The drawings were analysed using a comparative judgement approach [ Thurstone, 1927 ] whereby the quality of two responses were compared and these judgements used to place all the responses in a rank order. To increase reliability comparative judgement requires numerous comparisons from a larger number of judges and therefore a method using online technology to facilitate assessment of the scientific content of the drawings was chosen [ Tarricone & Newhouse, 2016 ]. Although originally developed for teacher assessment of English writing [ “No More Marking”, n.d. ], the No More Marking (NMM) website allows users to upload their own items (including drawings) which can then be compared with each other by a set number of judges. In the current study there were 14 judges involved in the process including the project team and associated staff and students, all of whom had a basic understanding of the scientific content of the workshop. Judges were asked to compare the pictures and identify the one which contained more scientific information. Each judge made approximately 50 judgements in total. The NMM algorithm ensures that each picture is seen by multiple judges and is compared to different pictures each time. NMM then returns ‘quality’ scores based on a Rasch logistic model [ Wheadon, Barmby, Christodoulou & Henderson, 2019 ] using a combination of individual judges’ comparisons. NMM also analyses judges’ performance for consistency of judgements which provides additional confidence in the results produced [ Jones, 2016 ].
In this study, rather than comparing an individual pupil’s pre- and post-intervention drawing, all drawings were compared as a group and quality scores were given for each intervention drawing. The data were further analysed to obtain the difference between the post and pre scaled scores for each pupil. A positive change in scores for the pupil would indicate that there was an increase in the quality of scientific content included in the pupil’s drawings after the intervention. We argue that, should there be no impact from the intervention, then we should expect roughly equal numbers of positive and negative quality score differences. If there is a positive impact, then the relative frequency for success should be greater than 50% (where success is defined as an increase in quality of scientific content). To examine the relative frequency of success, and hence potential impact of the intervention, a Bayesian version of the Binomial test is utilised to analsye the differences between post and pre quality scores (see Supplementary material for further details).
3.5 Analysing Likert scale questions
The Likert Scale data are ordinal, meaning there are a discrete number of categories which have a clear ordering but the distance between categories is not known. The category widths may also not represent equal increments. Thus, for the current intervention pupils were presented with Likert scales from not at all (very sad face) to lots ( very happy face ) , but for any individual the perceived difference between slightly sad face and slightly happy face might be different.
A typical approach to analysing Likert data of this form is to assume that the data is metric (that there is an equal increment between each point), and apply metric methodology, e.g., taking the mean of the scores. However, it has been suggested that applying metric models to ordinal data can lead to misinterpretation [ Liddell & Kruschke, 2018 ]. To analyse the data simply, frequency and percentages of responses can be obtained. Whilst useful this does not provide a level of confidence in the results. As such, the researchers follow the suggestion of Liddell and Kruschke [ 2018 ], and analyse the data with an ordinal model, in this case an ordered-probit model. Again a Bayesian approach is used, permitting the calculation of posterior probability distributions for the latent parameters for each individual questions, as well as an posterior distribution for effect size. An effect size larger than zero indicates a positive shift in pupil’s attitudes, and the posterior probability distribution indicates the confidence in the result (see Supplementary material for full details of the model used).
4 Results
4.1 Free response drawings
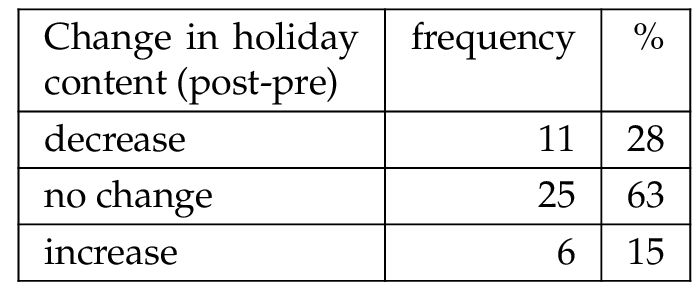
Before the intervention, 55% of the pupils’ responses to the prompt ‘Write or draw what the Sun makes you think about’ represented holiday scenes, often beaches or pools. After the intervention holiday scenes had decreased to 42.5% of the responses. Initially the responses were simply categorized as either a science context (‘0’ no science content, ‘1’ science content) or having holiday context (‘0’ no holiday content, ‘1’ holiday content). Comparison of the values post- and pre-intervention provided an indication if a pupil had moved from a holiday drawing to a science drawing or vice versa. For the majority of pupils there was no change in the broad context of their responses, but where there was a change in the context drawn by an individual, it tended to be towards including science content as shown in Table 1 .

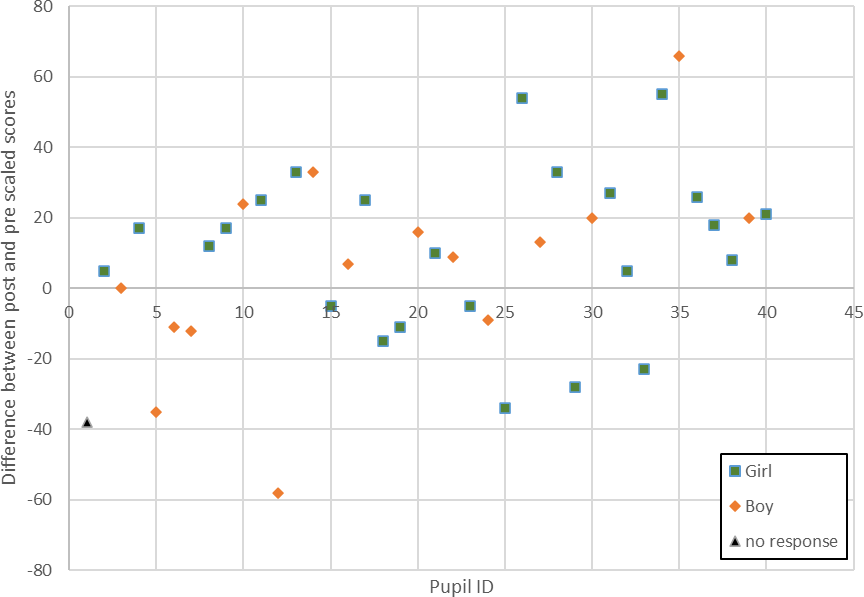
Individual responses were then uploaded to the No More Marking website and 14 judges completed the task of comparing pictures. The responses were ranked by the website algorithm and given a scaled score. The difference in scaled score was calculated for each pupil and mean difference values for all pupils, girls and boys were calculate. Figure 3 shows the difference between the post and pre scaled scores for all pupils. A positive difference indicates that the post intervention response was ranked more highly for scientific content than the pre-intervention response. The mean difference for all pupils was 7.9 (11.3 for girls, 5.5 for boys) and the median difference was 11 (14.5 for girls, 9 for boys) indicating that the post-intervention responses tended to contain more science content, with a stronger effect for girls.
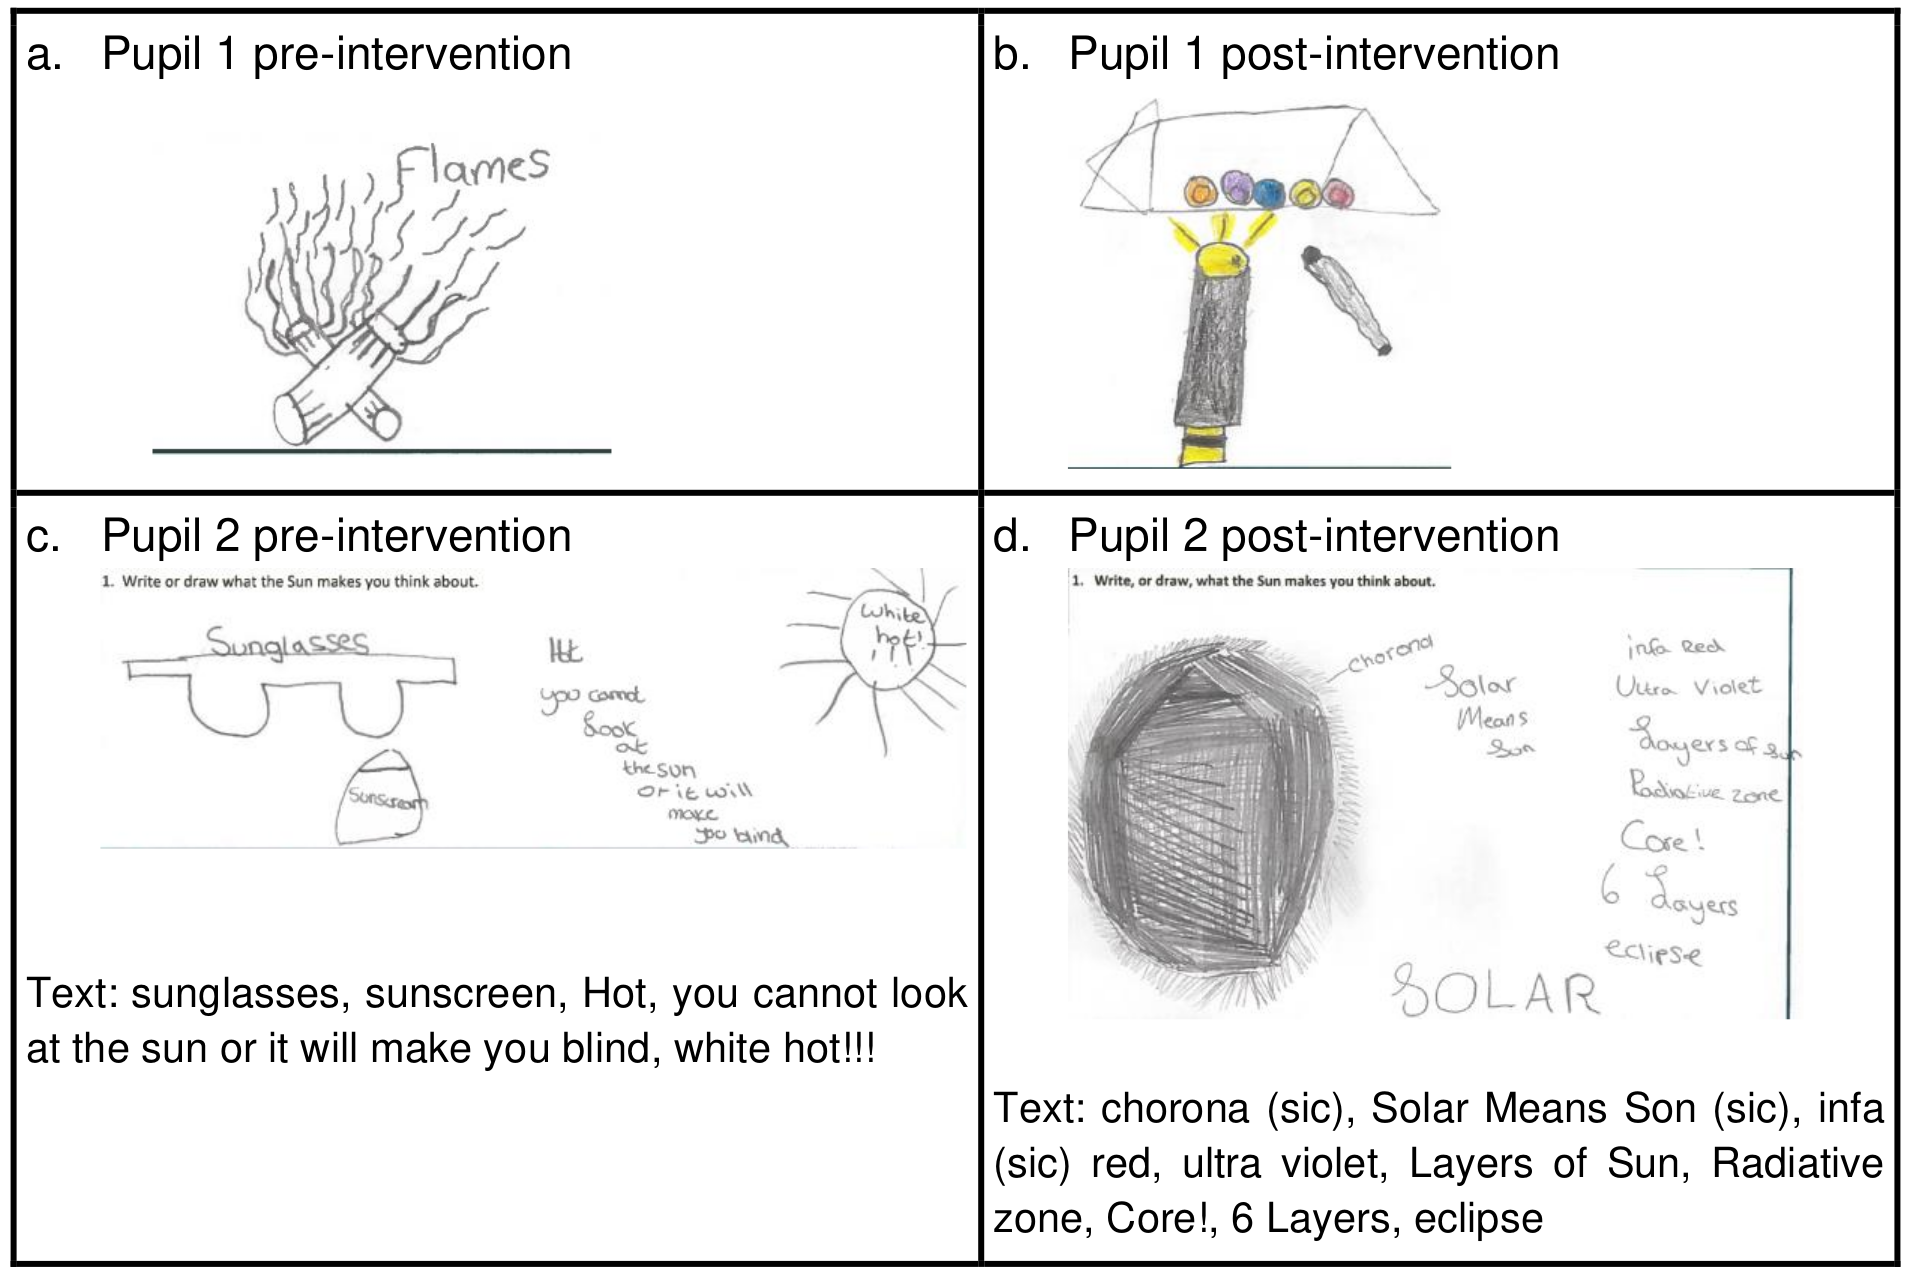
Some of the increases in scaled scores were due to the change in content of pupils’ drawings from holiday themed to science themed. Looking in more detail at those responses from individuals who included scientific information in their pre-intervention drawings, for the majority of the pupils there was a gain in understanding of solar science following the workshop as shown in the examples given in Figure 4 a–d.
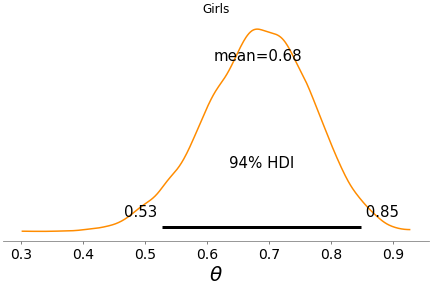
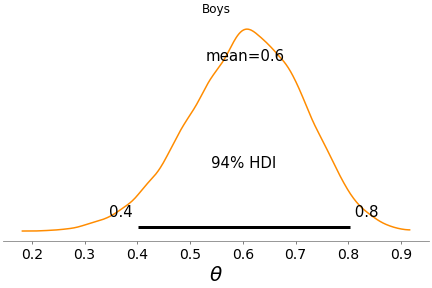
The Binomial test of the differences between post and pre quality scores for girls and boys was also undertaken and the posterior distributions obtained are shown in Figure 5 . The mean value of difference post and pre- intervention for girls was 0.68, which suggests that there has been an increase in the scientific content in the pictures/words used by the girls. The bulk of the posterior distribution for the relative frequency of success, , is above 0.5 (the 94% Highest Density Interval is shown as the horizontal black line on Figure 5 a), with only 2% of the probability density below 0.5. This indicates that values of are unlikely to be compatible with the data, hence supports the statement that the intervention made a difference for girls. The mean value of difference post and pre-intervention for boys was 0.6. However, there is more posterior density for , around 16%. Hence, we are not able to confidently rule out the possibility that the intervention did not lead to an increase in the scientific content of the boys’ responses.
(a) (b)
5
5.1 Likert scale questions
Comparison of pupils’ views on ‘ How much do you like science? ’ and ‘ How much would you like to have a job that involved science?’ pre- and post-intervention provides an indication of whether there has been a change in these aspects of science capital following the intervention. The responses were recoded as negative, neutral and positive depending on which face the pupils circled, and a frequency distribution obtained for girls and boys separately (Table 2 ).
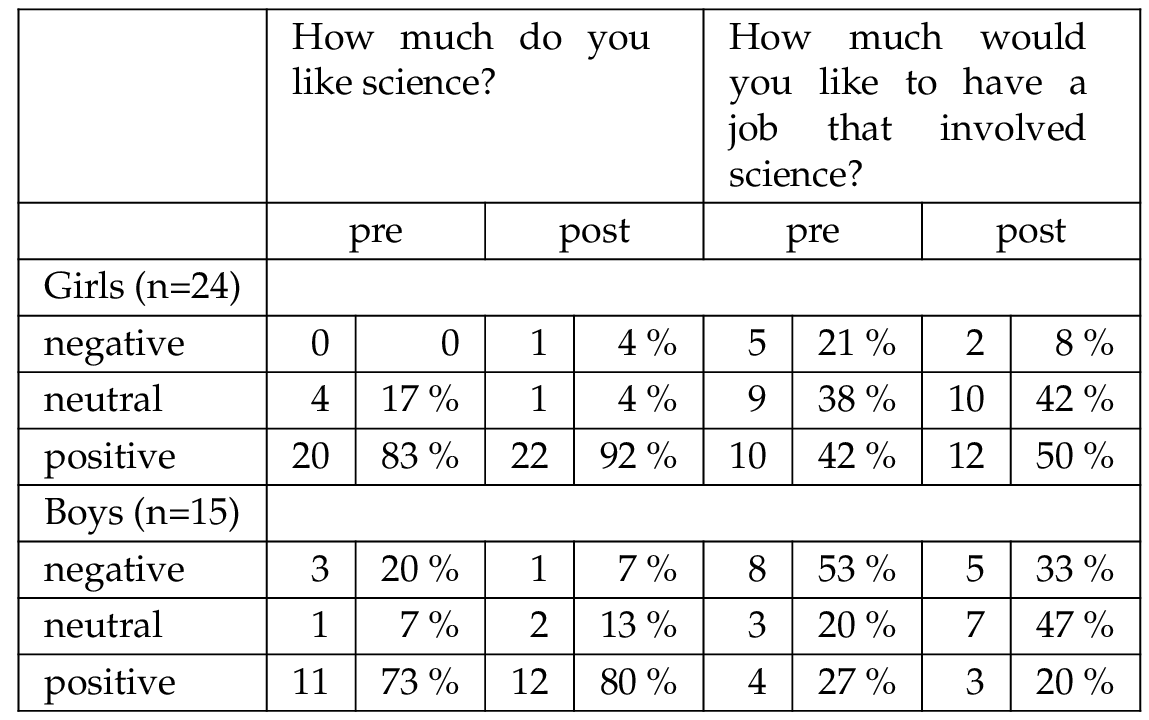
Prior to the intervention the majority of children responded that they liked science, with girls being more positive than boys, and this reported liking increased for both girls (+9%) and boys (+7%) after the intervention.
There was more of a spread of responses to the question about future jobs with more boys (53%) not wanting a job in science compared to girls (21%) prior to the intervention. After the intervention, there was a smaller percentage of children who responded negatively to having a job in science (girls %, boys %, but only 3 children in each case), with a corresponding increase in either neutral or positive responses. Interestingly, for boys the positive percentage decreased as one child went from giving a positive response to a neutral response.
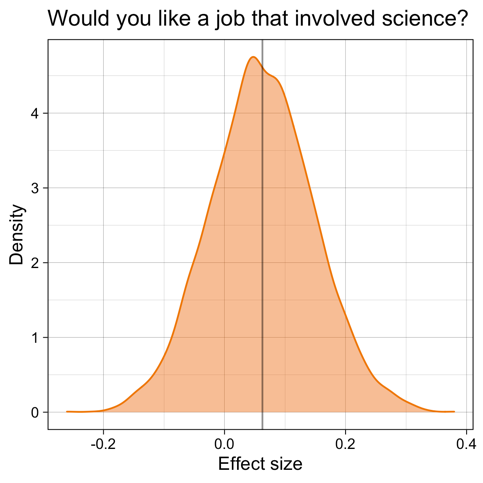
We can explore the responses to this question further using the Ordinal model for describing the data (see Supplementary Material). Of interest is the posterior distribution of the effect size, which should enable us to examine the difference pre and post the intervention. Figure 6 shows the posterior distribution for the effect size for all pupils, which has a mean effect size for all pupils is ~0.06 and can be classed as a small effect. Separate group analysis for girls and boys showed no significant difference for the separate cases, in part due to the small sample for each which leads to a large variance in the estimated model parameters.
6 Discussion and conclusion
This study indicates that children were generally positive about science both before and after the intervention. This finding supports previous research [ Clemence et al., 2013 ; Archer et al., 2015 ] showing general enjoyment of science amongst children and young people.
The first research question addressed in this study was ‘What are the affordances of using online comparative judgement to judge the scientific content of children’s drawings?’. The study shows that there are positive affordances of using NMM as an online comparative judgement method for the evaluation of science communication and STEM engagement activity. The project team found the process of using online comparative judgement to be straightforward. The majority of the project team and additional judges did not have a background in qualitative research methods, but were able to use the online system to make simple judgements. The process did not require extensive training or calibration of judgements. Judges were able to straightforwardly compare the two pictures that were presented to them. The time required to complete the 50 judgements required by each judge was relatively short.
The data produced by software were straightforward to analyse using both the simple difference analysis (Table 1 and Figure 3 ) and Bayesian analysis (Figure 5 ) and allowed clear comparisons of children’s answers before and after the intervention.
The use of online comparative judgement could therefore be used to address issues in the quality of evaluation of science communication and STEM engagement activities identified by other researchers [ Jensen, 2014 ; Ziegler et al., 2021 ] by providing a clear method of pre- and post-intervention evaluation.
The second research question addressed in this study was ‘Does taking part in a science-art intervention increase children’s knowledge about solar science?’
The data show that there was a small, but significant, increase in girls’ knowledge of the Sun and solar physics as shown from the comparison of the scientific content in their drawings before and after the intervention (Figure 4 ).
The use of drawings allowed children to provide a response which linked to the overall cross-curricular nature of the intervention and allowed pupils to show their scientific knowledge through art and through writing. The open-ended nature of the question (‘Write or draw what the Sun makes you think about’) allowed children to choose their own frame of reference to respond [ MacPhail & Kinchin, 2004 ]. For over half of the children this was to think about holidays and the Sun making them feel happy. These responses to the open elicitation question indicate that it would have been better to use a question which focused more clearly on children’s knowledge and understanding about the Sun. A more tightly constrained question would focus responses on the outcomes of the intervention whilst still allowing for children to respond through drawing. For example asking ‘Draw or write what you know about the Sun’ would support evaluation specifically of the change in children’s knowledge.
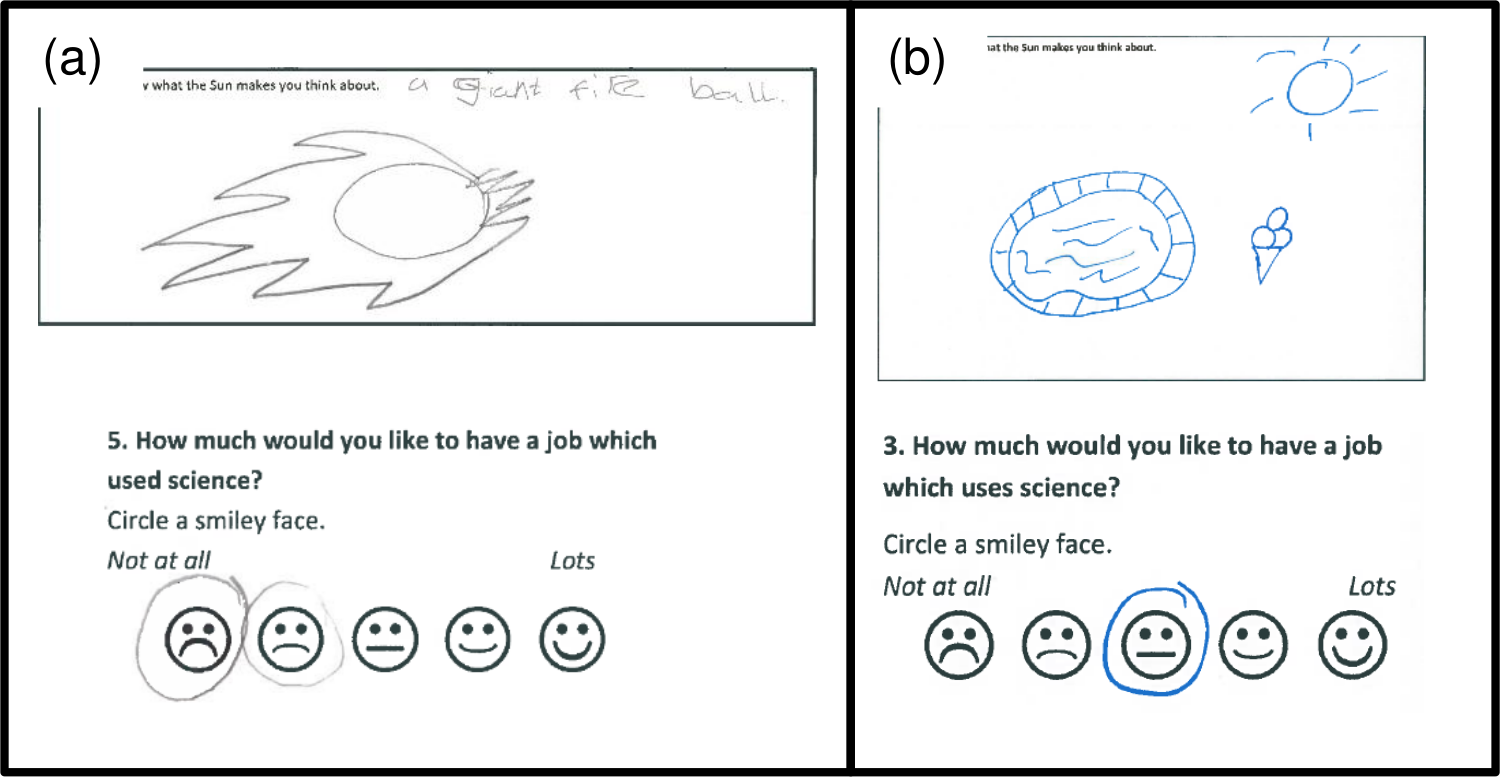
Using two different analyses of the No More Marking data provides additional depth to the results, with the simple analysis providing opportunity to explore individual changes in more detail, and the Binomial Test providing a measure of confidence in the findings. Some outliers were apparent in the NMM scaled scores and it was helpful to return to the raw data for these to explore why this might be. For example, in Figure 7 the responses are shown for the participant with largest negative change. The content of the drawing went from including scientific content before the workshop, to not including scientific content after the workshop and so the change in rank in the NMM data was negative. However, comparison of response to the ‘ How much would you like to have a job which uses science?’ shows a positive change for the participant from ‘not at all’ before the intervention to a neutral face after the intervention. This shows the importance of linking qualitative and quantitative data for full picture of the impact of an intervention.
The use of the full range of the Likert scales in the data indicate that pupils are using the full range of negative and positive options for at least some of the questions and does not support the suggestion that children’s responses may skew positive when using Likert scales [ Hall et al., 2016 ] at least when being asked about future jobs in science.
The challenge of attributing causation to a specific intervention is well known in many fields e.g. Inequality reduction [ Alegría & O’Malley, 2022 ], research impact, [ Reed et al., 2021 ] and Public Health [ Lewis et al., 2018 ]. One way to mitigate this challenge is to develop a Theory of Change approach [ Rogers, 2014b ] which includes causal pathways outlining possible mechanisms by which the intervention could lead to the identified outcome, and thus enable the attribution of causality [ Rogers, 2014a ]. Such a Theory of Change approach [Authors2020] was used in designing the STEM engagement activity described herein.
In the current study there is a (small) change in the number of children indicating that they would like a job involving science. This measure is commonly used in science communication and engagement evaluation [see e.g. Science and Technology Facilities Council, 2017 ; Ogden Trust, 2021 ; Shaftoe, M., 2019 ]. Whilst this change in intention following the workshop can only be correlational, it is of interest because previous longitudinal research has shown that there is a correlation between children and young people’s expressed desire for a ‘science job’ at age 10 and their future uptake of science subjects [ Archer, Moote, Macleod, Francis & DeWitt, 2020 ]. Thus, interventions which support, or develop children’s interest in a job involving science can provide a possible mechanism for future impact.
In conclusion, the current paper indicates that the use of open-response questions and drawing with young children provides a helpful method of identifying changes in scientific knowledge before and after a cross-curricular workshop linking science and art. Following Ziegler et al. [ 2021 ] we present the evaluation as a way of sharing learning with the science communication community. We found that the use of online comparative marking to rank children’s responses allows a straight-forward method for data analysis which can be used by science communication and engagement project teams who may not have a background in qualitative methods.
Acknowledgments
The Imagining the Sun project would not have been possible without Helen Schell (Visual Artist), Katrina Porteous (Poet) and Peter Zinovieff (composer). The authors would like to thank them for their insight and creativity. We would also like to thank Krishna Mooroogen for his contribution to the delivery of the project. This project was funded by the Science and Technology Facilities Council (STFC) ST/N005562/1. Additionally, this project has received funding from the European Union’s Horizon 2020 research and innovation programme for the period January 2019 until December 2022 under Grant Agreement No 824135 (SOLARNET). R.M is supported by a UKRI Future Leader Fellowship (RiPSAW—MR/T019891/1).
References
-
Alegría, M. & O’Malley, I. S. (2022). Opening the black box: Overcoming obstacles to studying causal mechanisms in research on reducing inequality . William T. Grant Foundation. New York, U.S.A. Retrieved from https://wtgrantfoundation.org/library/uploads/2022/03/Alegria-Omalley_WTG-Digest-7.pdf
-
Anjos, S., Aibeo, A. & Carvalho, A. (2019). Observing and drawing the Sun: research-based insights to assess science communication practices aimed at children. Journal of Science Communication 18 (04), A03. doi: 10.22323/2.18040203
-
Archer, L., Dawson, E., DeWitt, J., Seakins, A. & Wong, B. (2015). “Science capital”: A conceptual, methodological, and empirical argument for extending bourdieusian notions of capital beyond the arts. Journal of Research in Science Teaching 52 (7), 922–948. doi: 10.1002/tea.21227
-
Archer, L., Moote, J., Macleod, E., Francis, B. & DeWitt, J. (2020). ASPIRES 2: Young people’s science and career aspirations, age 10–19 . UCL Institute of Education. London, U.K.
-
Australian Government (2017). Australia’s National Science Statement. Retrieved from https://www.industry.gov.au/publications/australias-national-science-statement
-
Blackburn, J., Harris, M., Mowlah, A. & Niblett, V. (2014). The Value of arts and culture to people and society: An evidence review . Arts Council England. Retrieved from https://www.artshealthresources.org.uk/docs/the-value-of-arts-and-culture-to-people-and-society/
-
BP (2021). Science capital and the STEM skills gap. Retrieved from https://www.bp.com/en_gb/united-kingdom/home/community/stem-education/stem-skills-gap-science-capital.html
-
Clapp, E. P., Solis, S. L., Ho, C. K. N. & Sachdeva, A. R. (2019). Complicating STEAM: A critical look at the Arts in the STEAM Agenda. In P. M. A. & H. R. (Eds.), Encyclopedia of Educational Innovation . Singapore: Springer.
-
Clemence, M., Gilby, N., Shah, J., Swiecicka, J., Warren, D., Smith, P. & Souza, J. D. (2013). Wellcome trust monitor wave 2. Tracking public views on science, research and science education . London, U.K.: Wellcome Trust.
-
Colucci-Gray, L., Trowsdale, J., Cooke, C. F., Davies, R., Burnard, P. & Gray, D. S. (2017). Reviewing the potential and challenges of developing STEAM education through creative pedagogies for 21st learning: How can school curricula be broadened towards a more responsive, dynamic, and inclusive form of education? British Educational Research Association.
-
Davenport, C., Dele-Ajayi, O., Emembolu, I., Morton, R., Padwick, A., Portas, A., … Woodward, J. (2020). A Theory of Change for Improving Children’s Perceptions, Aspirations and Uptake of STEM Careers. Research in Science Education 51 (4), 997–1011. doi: 10.1007/s11165-019-09909-6
-
Davies, S. R. (2013). Research staff and public engagement: a UK study. Higher Education 66 (6), 725–739. doi: 10.1007/s10734-013-9631-y
-
Department for Education (2017). Careers strategy: making the most of everyone’s skills and talents. Retrieved from https://assets.publishing.service.gov.uk/government/uploads/system/uploads/attachment_data/file/664319/Careers_strategy.pdf
-
DeWitt, J., Archer, L. & Mau, A. (2016). Dimensions of science capital: exploring its potential for understanding students’ science participation. International Journal of Science Education 38 (16), 2431–2449. doi: 10.1080/09500693.2016.1248520
-
Engineering UK (2018). Engineering UK 2018: The State of Engineering . London, U.K.: Engineering UK.
-
Excell, J. (2019, February 25). Supercharging STEM engagement with science capital. The Engineer . Retrieved from https://www.theengineer.co.uk/science-capital-stem-engagement/
-
Fischhoff, B. (2019). Evaluating science communication. Proceedings of the National Academy of Sciences 116 (16), 7670–7675. doi: 10.1073/pnas.1805863115
-
Hall, L., Hume, C. & Tazzyman, S. (2016). Five Degrees of Happiness. In Proceedings of the The 15th International Conference on Interaction Design and Children . doi: 10.1145/2930674.2930719
-
Jensen, E. (2014). The problems with science communication evaluation. JCOM 13 (01), C04. doi: 10.22323/2.13010304
-
Jones, N. (2016). ‘No More Marking’: An online tool for comparative judgement. Cambridge English Research Notes 63 (March), 12–15.
-
King, H., Steiner, K., Hobson, M., Robinson, A. & Clipson, H. (2015). Highlighting the value of evidence-based evaluation: pushing back on demands for ‘impact’. JCOM 14 (02), A02. doi: 10.22323/2.14020202
-
Land, M. H. (2013). Full STEAM Ahead: The Benefits of Integrating the Arts Into STEM. Procedia Computer Science 20 , 547–552. doi: 10.1016/j.procs.2013.09.317
-
Lewis, C. C., Klasnja, P., Powell, B. J., Lyon, A. R., Tuzzio, L., Jones, S., … Weiner, B. (2018). From Classification to Causality: Advancing Understanding of Mechanisms of Change in Implementation Science. Frontiers in Public Health 6 . doi: 10.3389/fpubh.2018.00136
-
Liddell, T. M. & Kruschke, J. K. (2018). Analyzing ordinal data with metric models: What could possibly go wrong? Journal of Experimental Social Psychology 79 , 328–348. doi: 10.1016/j.jesp.2018.08.009
-
MacPhail, A. & Kinchin, G. (2004). The use of drawings as an evaluative tool: students’ experiences of sport education. Physical Education & Sport Pedagogy 9 (1), 87–108. doi: 10.1080/1740898042000208142
-
Magliaro, S. G., Lockee, B. B. & Burton, J. K. (2005). Direct instruction revisited: A key model for instructional technology. Educational Technology Research and Development 53 (4), 41–55. doi: 10.1007/bf02504684
-
McDougall, M., Bevan, B. & Semper, R. (2012). Art as a Way of Knowing, Exploratorium. Conference report. Retrieved from https://www.exploratorium.edu/files/pdf/cils/Art_as_a_Way_of_Knowing_report.pdf
-
Mejias, S., Thompson, N., Sedas, R. M., Rosin, M., Soep, E., Peppler, K., … Bevan, B. (2021). The trouble with STEAM and why we use it anyway. Science Education 105 (2), 209–231. doi: 10.1002/sce.21605
-
Morgan, R. & Kirby, C. (2016). The STEM Education Landscape . London, U.K.: Royal Academy of Engineering. Retrieved from https://www.raeng.org.uk/publications/reports/uk-stem-education-landscape
-
National Audit Office (2018). Delivering STEM (science, technology, engineering and mathematics) skills for the economy . HC 716 SESSION N 2017–2019. London, U.K.: The Stationary Office. Retrieved from https://www.nao.org.uk/wp-content/uploads/2018/01/Delivering-STEM-Science-technology-engineering-and-mathematics-skills-for-the-economy.pdf
-
No More Marking (n.d.). Retrieved from https://www.nomoremarking.com/
-
Office of Science And Technology Policy (2020). Progress report on the implementation of the Federal STEM education strategic plan . Retrieved from https://trumpwhitehouse.archives.gov/wp-content/uploads/2017/12/Progress-Report-Federal-Implementation-STEM-Education-Strategic-Plan-Dec-2020.pdf
-
Ogden Trust (2021). Capturing impact: an informal science education evaluation toolkit. Retrieved from https://www.ogdentrust.com/assets/general/Evaluation-Toolkit-FINAL_March-2021.pdf
-
Perignat, E. & Katz-Buonincontro, J. (2019). STEAM in practice and research: An integrative literature review. Thinking Skills and Creativity 31 , 31–43. doi: 10.1016/j.tsc.2018.10.002
-
Pickstone, J. V. (2011). A Brief Introduction to Ways of Knowing and Ways of Working. History of Science 49 (3), 235–245. doi: 10.1177/007327531104900301
-
Quigley, C. F., Herro, D. & Jamil, F. M. (2017). Developing a Conceptual Model of STEAM Teaching Practices. School Science and Mathematics 117 (1–2), 1–12. doi: https://doi.org/10.1111/ssm.12201
-
Rabalais, M. E. (2014). STEAM: A National Study of the Integration of the Arts into STEM instruction and its Impact on Student Achievement (Dissertation, University of Louisiana at Lafayette). UMI Number: 3687702.
-
Reed, M., Ferré, M., Martin-Ortega, J., Blanche, R., Lawford-Rolfe, R., Dallimer, M. & Holden, J. (2021). Evaluating impact from research: A methodological framework. Research Policy 50 (4), 104147. doi: 10.1016/j.respol.2020.104147
-
Reynolds-Keefer, L. & Johnson, R. (2011). Is a Picture Is Worth a Thousand Words? Creating Effective Questionnaires with Pictures. Practical Assessment, Research and Evaluation 16 , 1–7.
-
Rogers, P. (2014a). Overview: Strategies for causal attribution, methodological briefs: impact evaluation 6 . Florence, Italy: UNICEF Office of Research. Retrieved from https://www.unicef-irc.org/publications/751-overview-strategies-for-causal-attribution-methodological-briefs-impact-evaluation.html
-
Rogers, P. (2014b). Theory of change, methodological briefs: impact evaluation 2 . Florence, Italy: UNICEF Office of Research. Retrieved from https://www.unicef-irc.org/publications/747-theory-of-change-methodological-briefs-impact-evaluation-no-2.html
-
Schunk, D. H. (2012). Learning theories: an educational perspective (6th ed.). Pearson.
-
Science and Technology Facilities Council (2017). Public Engagement Evaluation Framework. Retrieved from https://www.ukri.org/wp-content/uploads/2017/04/STFC-Public-engagement-evaluation-framework-v1.1April2017-104205-web-1.pdf
-
Scottish Government (2020). STEM Education and Training Strategy for Scotland. Retrieved from https://www.gov.scot/publications/stem-strategy-education-training-scotland-second-annual-report/documents/
-
Shaftoe, M. (2019). Bring It On Impact report 2019 . Retrieved from https://www.bringitonne.co.uk/wp-content/uploads/2020/09/BIO-Impact-report-2019.pdf
-
STEM Learning (2016). STEM Ambassadors: Making an impact .
-
Tarricone, P. & Newhouse, C. P. (2016). Using comparative judgement and online technologies in the assessment and measurement of creative performance and capability. International Journal of Educational Technology in Higher Education 13 (1). doi: 10.1186/s41239-016-0018-x
-
Thurstone, L. L. (1927). A Law of Comparative Judgment. Psychological Review 34 (4), 273–286. [Reprinted in: (1994) Psychological Review 101 (2), 266–270]. doi: 10.1037/h0070288
-
Warden, C. (2015). Talking and thinking floorbooks: Using big book planners to consult children (3rd ed.). Perth, Australia: Mindstretchers. Retrieved from https://mindstretchers.academy/shop/talking-and-thinking-floorbooks-3rd-ed.-paperback
-
Welsh Government (2016). Science, Technology, Engineering and Mathematics (STEM) in education and training. A delivery plan for Wales. Retrieved from https://gov.wales/sites/default/files/publications/2018-02/science-technology-engineering-and-mathematics-a-delivery-plan-for-wales.pdf
-
Wheadon, C., Barmby, P., Christodoulou, D. & Henderson, B. (2019). A comparative judgement approach to the large-scale assessment of primary writing in England. Assessment in Education: Principles, Policy & Practice 27 (1), 46–64. doi: 10.1080/0969594x.2019.1700212
-
Ziegler, R., Hedder, I. R. & Fischer, L. (2021). Evaluation of Science Communication: Current Practices, Challenges, and Future Implications. Frontiers in Communication 6 . doi: 10.3389/fcomm.2021.669744
Authors
Carol Davenport is Associate Professor at Northumbria University, Newcastle. She is the
director of NUSTEM, a research and outreach group. Her research interests are children’s
career aspirations and how these are shaped by the community around them. She is also
interested in developing classroom resources that teachers can use to embed careers into
their teaching.
@DrDav
E-mail:
carol.davenport@northumbria.ac.uk
.
Richard Morton in Associate Professor at Northumbria University, Newcastle. He
leads a research group studying the role magnetohydrodynamic (MHD) waves play in
transferring energy through the Sun’s atmosphere, powering the heating of the
million-degree solar wind and its acceleration to a million miles per hour. He is
enthusiastic about outreach and regularly collaborates with colleagues to take solar
physics to a wider audience.
@rjmorton_solar
E-mail:
Richard.morton@northumbria.ac.uk
.