

1 Introduction
Probabilities and risks play a crucial role in science communication. Doctors inform their patients about the probability of a successful treatment and the risks of side-effects. Climate researchers want to convey the probability of different climate change scenarios. Science journalists report on estimated probabilities and risks in many different fields. And every day people make decisions based on these probabilities and risks. Due to this dependence of the decision maker on the information provider, it is important that the message is understood as intended in order to minimize the risk of miscommunication.
Many estimated probabilities are communicated verbally, with terms such as very likely instead of exact percentages. In that case it is important that the interpretation of the verbal probability phrase is the same for both sender and receiver. For example, in health communication there are guidelines that state that side-effects that occur in 1–10% of patients should be referred to as common . But when the side-effect of constipation was described as common to patients, they estimated on average that 34.2% of people would experience constipation [Knapp, Raynor and Berry, 2004 ]. Such overestimations of risks can decrease medicine adherence or can lead to nocebo effects where people will actually experience more side-effects.
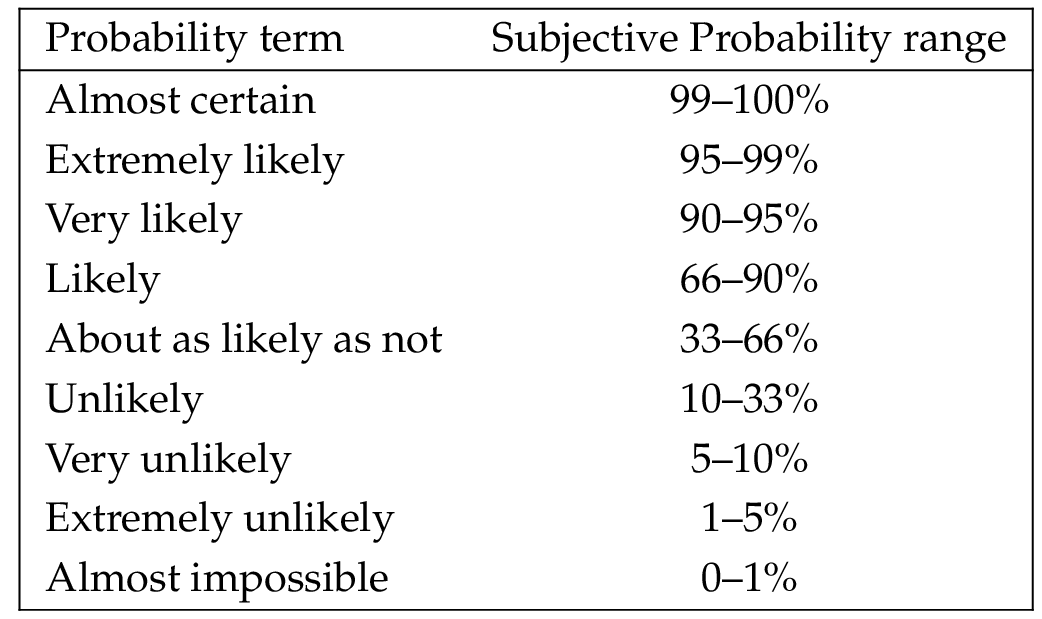
Many organisations use probability scales as in Table 1 as a guideline on how probability phrases should be interpreted such that their risk communication is standardized. But how well do these translations match with how people actually interpret these phrases? How do people translate these verbal probability phrases back into numbers?
In early studies on the interpretation of probability phrases respondents were asked to give their interpretation of a probability expression as a single value or range on a scale of 0–1 or 0–100% or were asked to rank them. The phrases were either presented out-of-context or in sentences describing a particular situation. Many of these studies were summarized in the literature reviews by Druzdzel [ 1989 ] and Visschers et al. [ 2009 ] and the meta-analysis by Theil [ 2002 ].
The overall conclusion from these studies was that, although individuals seem to be internally consistent in their ranking of probability phrases [Budescu and Wallsten, 1985 ] and their perception of them over time [Bryant and Norman, 1980 ], the interpretation of these phrases varies greatly among individuals. This interpretation variability is especially large for phrases expressing a probability in the range from 20% to 80%. For words that express extreme probabilities, such as always , certain , never , and impossible , consensus was highest. This variability of interpretations is represented by the varying widths of the subjective probability ranges in probability scales as in Table 1 . These wide ranges complicate communication, because it is impossible to express a very specific probability.
Several studies also showed that the numerical interpretations of some probability phrases overlap or are very similar. For example, Reagan, Mosteller and Youtz [ 1989 ] concluded that likely is synonymous with probable, and low chance with unlikely and improbable . Synonymous words have overlapping probability ranges which would complicate a probability scale. The codification presented in Table 1 seems to avoid this complication by limiting the vocabulary to phrases with non-overlapping ranges.
Furthermore, translation issues for verbal probability expressions are important for all international organizations that publish their documents in more than one language. For example, a question that may arise within the European Food Safety Authority is whether their probability scale (Table 1 ) translates directly to other European languages, or whether the subjective probability ranges in the second column should be adjusted, and consequently, the expressions in the documentation text.
Most research on the numerical interpretation of probability phrases was conducted in English. There have been some replication studies in other languages, among which the Dutch language. Most of the Dutch studies are over twenty years old. For instance, Eekhof, Mol and Pielage [ 1992 ] focused on the interpretation of 30 Dutch phrases. However, all phrases in this study expressed frequencies (like often , always , and rarely ) instead of probabilities (like certain , likely , and low chance ). In a later study by Timmermans [ 1994 ] some probability phrases were included, usually in combination with an adverb like quite or rather . Unfortunately, the article is written in English and does not provide the Dutch expressions used in the study, hence it is unclear exactly which Dutch expressions and adverbs were investigated. In a study by Pander Maat and Klaassen [ 1996 ], focus was on the interpretation of uncertainty in information leaflets that come with medicine. Although their main interest was not in the numerical values associated with verbal probability phrases, they did investigate this for three phrases. Renooij and Witteman [ 1999 ] did several experiments to develop a probability scale containing both words and numbers. Their focus was on ranking seven probability phrases and developing their corresponding numerical scale. Given that the first study included many phrases but only frequencies, and the other three studies included only a few probability phrases, usually in combination with adverbs, many Dutch probability expressions still needed to be studied.
In addition to replication studies in other languages, several studies have been done to compare the interpretation variability of English probability phrases with the interpretations of their translations to other languages. Three studies, comparing English with French [Davidson and Chrisman, 1994 ], German [Doupnik and Richter, 2003 ], and Chinese [Harris et al., 2013 ], showed that on average the numerical interpretations of the English phrases differ from the interpretation of their counterparts in the three other languages. Additionally, in French and Chinese, the standard deviations of the numerical values related to the probability phrases were much larger than those of the original English wording. These results show that the meaning of probability expressions can get lost in translation from one language to another.
In our study we focus on the interpretation of Dutch verbal probability phrases given in neutral contexts. In the next section we give an overview of theories and results from (science) communication literature that determined the set-up of our study.
2 Background
2.1 The communication mode preference paradox
Until recently, it was generally believed that information providers, the senders of a message, prefer to express probabilities verbally, namely by using verbal probability expressions as unlikely , usually and maybe , while decision makers favour numeric expressions like percentages. Druzdzel [ 1989 ] reasoned that senders prefer verbal expressions because these convey some amount of uncertainty. Including this uncertainty in the expression is favoured by senders, because probability estimates are usually based on empirical data and therefore not sufficiently precise to be translated into exact numerical statements. Hence, if a numerical value is given, its suggested precision may be misleading. On the other hand, decision makers prefer this precision of numerical expressions, since numeric values are easier to compare and to draw conclusions from. Erev and Cohen [ 1990 ] referred to this difference in preference as the communication mode preference paradox .
In more recent studies, researchers have challenged this theory, but the results are not conclusive. For example, Juanchich and Sirota [ 2019 ] concluded that people favour verbal phrases in general, but in some contexts or for specific purposes numerical expressions are preferred.
2.2 Asymmetry
A complication in the interpretation of probability phrases is asymmetry. For example, based on the discovery of the synonymous pair low chance with unlikely and improbable , Reagan, Mosteller and Youtz [ 1989 ] also expected high chance to be synonymous with likely and probable . However, their data indicated that actually very likely and very probable are its synonyms. This unbalanced result shows that there is some asymmetry in the interpretation of probability phrases.
This phenomenon of asymmetry in the interpretation of mirrored probability phrases is studied and confirmed by many researchers. In most studies, this imbalance is investigated on a group level by comparing the group means or medians of two complementary phrases. For instance, Lichtenstein and Newman [ 1967 ] concluded that the interpretations of likely and unlikely are asymmetric, since their means sum to (72% + 18% =) 90% and their medians sum to (75% + 16% =) 91% instead of 100%. This asymmetry was confirmed by both Reagan, Mosteller and Youtz [ 1989 ] (medians sum to 90%) and Stheeman et al. [ 1993 ] (medians sum to 80%). Furthermore, Lichtenstein and Newman [ 1967 ] focused on the influence of adverbs (such as very , quite and fairly ) and found that, for instance, the means of the numeric probabilities given to quite likely and quite unlikely sum to (79% + 11% =) 90% instead of 100%.
Previous studies have also shown that some terms actually are (almost) symmetrical. For example, very likely and very unlikely (mean interpretations sum to 96% [Lichtenstein and Newman, 1967 ] ), and almost always and almost never (median interpretations sum to 98% [Stheeman et al., 1993 ] ).
Some mirrored terms have a clear linguistic explanation for their asymmetry. For example, Mosteller and Youtz [ 1990 ] studied the terms possible and impossible and found that the interpretation of impossible is stable (around 3% for all participants of the study), while possible has distinct meanings for different people. Namely, some respondents used the literal interpretation of possible and indicated that it could indicate any percentage between 0% and 100%, and others associated it with rare events that only scarcely occur (as in barely possible ). Hence, the different interpretations of possible causes the strong asymmetry with its mirrored expression impossible . The asymmetry in the interpretation of certain and uncertain can be explained in a similar way.
The asymmetry in the interpretation of verbal probability expressions complicates the development of probability tables. Namely, if a probability scale is symmetric, it is easier to use. For example, the symmetry of the probability scale in Table 1 simplifies the use of the table. However, since research showed that people do not necessarily interpret mirrored phrases in a symmetrical way, symmetric tables do not necessarily represent the actual interpretation of its terms.
All these research results show that the interpretations of verbal probability expressions vary too much to translate them into a (symmetrical) probability scale of which the numerical probability ranges would be supported by everyone. Therefore, many researchers who initially intended to make a translation table, concluded that such a codification is practically impossible [Lichtenstein and Newman, 1967 ; Mosteller and Youtz, 1990 ; Weber and Hilton, 1990 ; Timmermans and Mileman, 1993 ], or realized that their currently used table was actually not conveying the intended probabilities [Pander Maat and Klaassen, 1996 ]. Yet, still many organizations are using tables like this.
2.3 Context dependence
The interpretation of a probability phrase is influenced enormously by its context. For instance, compare your numerical interpretation of the word likely in the next two statements:
- It is likely that it will rain in Manchester, England, next June;
- It is likely that it will rain in Barcelona, Spain, next June.
Probably, your numerical interpretation of likely in the first statement is higher than in the second. Wallsten, Fillenbaum and Cox [ 1986 ] used this example and, based on their research, predicted a difference in the numerical interpretation of these statements. Namely, in their study, they showed that an individual’s expected base-rate of a context scenario influences this person’s interpretation of the probability phrase. In this example the base-rate for the first scenario is higher (in spring rain is more probable in England than in Spain) and this influences the interpretation of the word likely .
This hypothesis on the base-rate effect was confirmed by Weber and Hilton [ 1990 ], who, additionally, provided evidence that other variables may be affecting the interpretation as well. According to their findings, the perceived severity or consequentiality of an event and its emotional valence will also influence the judged probability.
Since it was shown that context may influence the interpretation of probability phrases, many researchers decided to investigate them out-of-context. However, it was argued by Druzdzel [ 1989 ] that, if no specific context is provided, participants may invent their own context. Due to these self-created contexts, participants’ responses will portray the interpretation of the probability phrases in many completely different contexts instead of out-of-context. These different scenarios may cause extra variability in the data which makes it more difficult to draw conclusions from the results.
2.4 Differences between sub-populations
In most studies, data on the interpretation of probability phrases was gathered within specific sub-populations. Participants were, for instance, physicians [Bryant and Norman, 1980 ], science writers [Mosteller and Youtz, 1990 ], radiologists [Stheeman et al., 1993 ], biological scientists [MacLeod and Pietravalle, 2017 ], or patients [Pander Maat and Klaassen, 1996 ]. Although all these studies showed variability in the perception of probability phrases within these sub-populations, one might wonder whether there are any differences between these groups as well. For example, Theil [ 2002 ] argued that there may be a difference between professionals who regularly make and communicate probability estimations, and persons who are inexperienced in this respect. However, his meta-analysis did not provide evidence for this hypothesis.
In studies on the use of jargon in science communication, it has been shown that there is a significant difference in the interpretation of medical terms between doctors and patients [Boyle, 1970 ] and of hydrological vocabulary between experts and laypeople [Venhuizen et al., 2019 ]. Experts may be unaware of this difference [Castro et al., 2007 ] and, hence, their use of jargon may cause a miscommunication of information.
Given these results on the different interpretations of jargon, there is reason to believe that there may be differences between the numerical interpretations of probability expressions of experts and laypeople as well, as Theil [ 2002 ] suggested. If this hypothesis is correct, experts may be misunderstood if they express probabilities verbally.
2.5 Gaps in the literature
Summarizing, we see that despite ongoing interest in and usage of verbal probability expressions, there are large gaps in the literature. Furthermore, in most studies on this topic, the sample sizes were quite small. For instance, the number of participants in the Dutch studies lay between 78 [Timmermans, 1994 ] and 101 [Eekhof, Mol and Pielage, 1992 ]. The English studies have comparable sample sizes, for example, in the nine studies mentioned by Theil [ 2002 ] the median number of participants is 52 and the mean is 170.
Therefore, we set up a large-scale study for the interpretation of Dutch verbal probability expressions, presented in a neutral context which are based on ordinary events. By choosing a neutral context, we try to eliminate any prior beliefs about the context. In this way we can investigate whether there is also a large variability in interpretation if it is not influenced by these prior beliefs.
Additionally, we check for synonymous phrases and asymmetry since these two characteristics are well studied in English but have not yet been analyzed in Dutch studies. Furthermore, we compare the results of statisticians with those of laypeople to check whether experts use different interpretations.
3 Methods
We used a survey design where probability phrases were presented in a neutral sentence to participants, and they could give their interpretation as a point estimate on a 0–100% scale. The survey was distributed online via Twitter and mailing lists of Dutch statistical societies in order to reach a large number of people.
3.1 Choice of phrases
There are many Dutch probability and frequency phrases that can be studied. To make a selection for our study, we first listed the phrases used in the English studies and translated them to Dutch. For translation Google Translate [Google, 2018 ] and the leading Dutch dictionary Van Dale [Van Dale Uitgevers, 2018 ] were used. If more than one translation was appropriate, both were added to the list. Then we added the expressions from previous Dutch studies [Eekhof, Mol and Pielage, 1992 ; Renooij and Witteman, 1999 ; Pander Maat and Klaassen, 1996 ]. This resulted in a list of 131 phrases.
This list was too long to use in one survey, so a selection had to be made. Since the most frequently used phrases are also the most relevant, we selected the verbal probability expressions that were used at least 100 times in all online available articles of the popular Dutch news website nu.nl . To prevent too much overlap with the research by Eekhof, Mol and Pielage [ 1992 ], only the ten most commonly used frequency phrases were selected. Furthermore, some combinations of adverbs with a probability phrase were removed from the list to prevent too much overlap with the study by Timmermans [ 1994 ], and to prevent repetitions of very similar phrases. Additionally, the word undecided was removed, since it was mostly used in sport results where it has a different meaning.
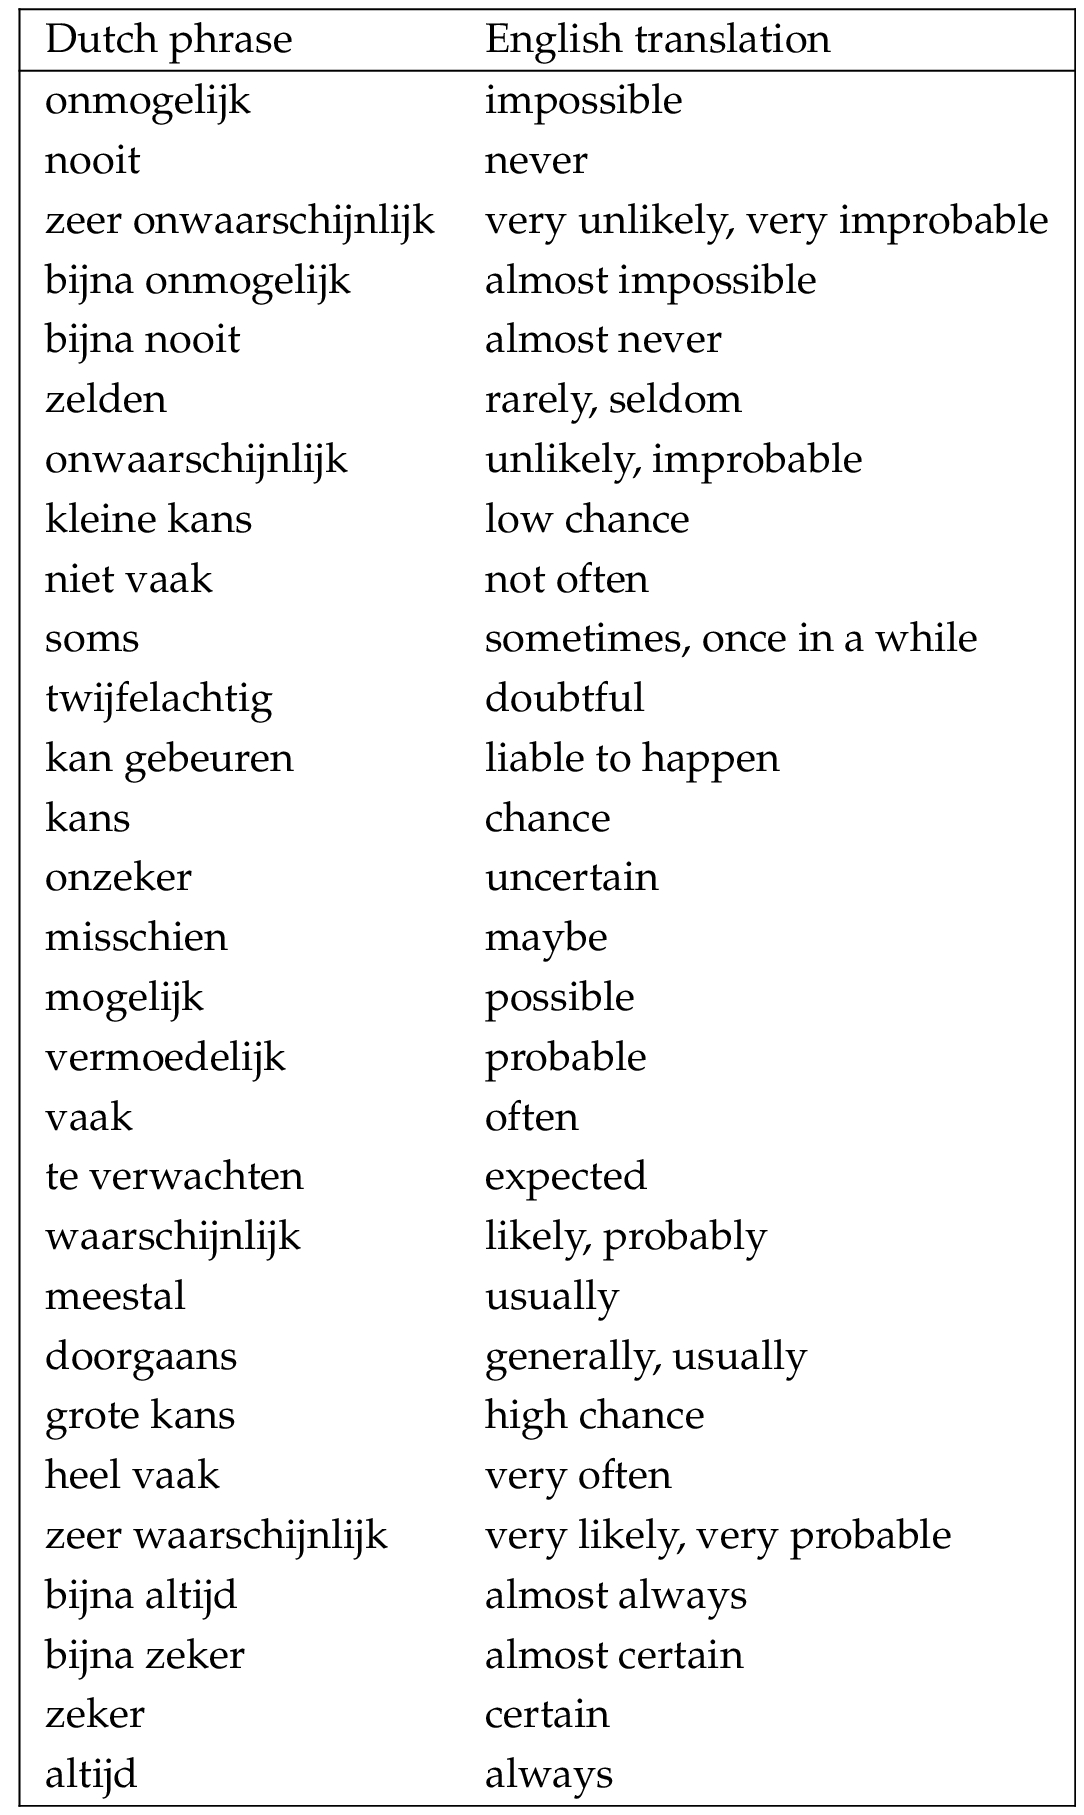
This method of phrase selection resulted in a list of 29 frequency and probability expressions. These phrases, and their English translations, are given in Table 2 in appendix A . In this article, we will use the English translations. Please keep in mind that all given numerical interpretations for these phrases are actually for their Dutch counterparts.
3.2 Context
As described before, the interpretation of a probability expression may be influenced by a person’s prior expectations of the phrase’s context. To avoid these base-rate effects, our aim was to formulate sentences that are neutral in the sense that everyone can imagine the situation but has little prior expectations about it. Some examples of the statements, formulated with the probability phrase likely , are
- It is likely that this plan succeeds.
- It is likely that this hotel is fully booked.
- It is likely that the team wins a match.
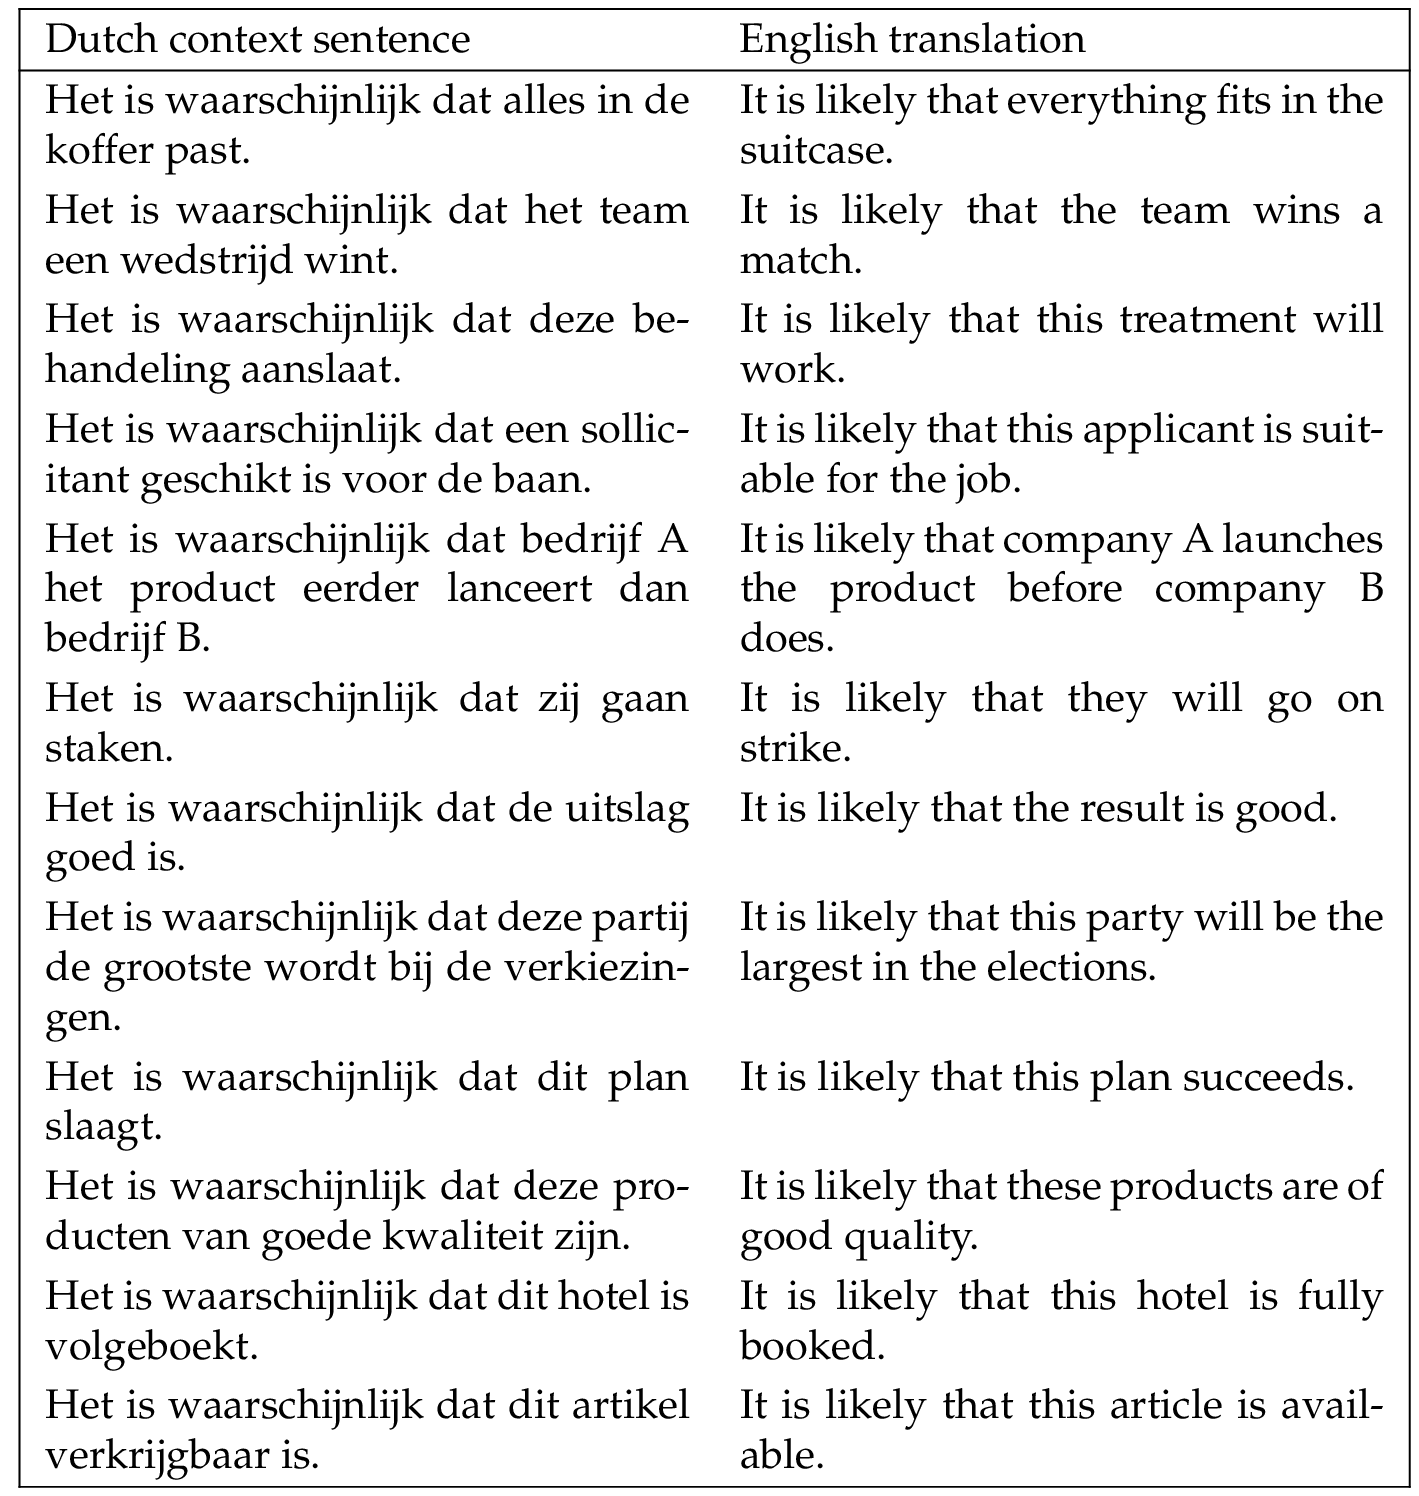
We tried to minimize the base-rate effect by not specifying a specific plan, hotel, or team. We developed twelve sentences like these. The complete list of these contexts is given in Table 3 in appendix B . In each sentence the verbal probability expression was printed in bold to direct more attention to it.
3.3 Numeric interpretations
For each probability expression in the survey, participants gave the point estimate of their numerical interpretation in percentages (0–100%) by using a slider. After the statement, each survey item was formulated as a question. For example, the questions related to the three statements above were formulated as follows:
- What is the probability (expressed in percentages) that this plan succeeds?
- What is the probability (expressed in percentages) that this hotel is fully booked?
- What is the probability (expressed in percentages) that the team wins a match?
All probability phrases were presented individually and in a random order, and participants were required to answer each question before continuing to the next. In this way, missing data was prevented.
3.4 Randomization
To prevent a systematic influence of the context on the interpretation of the probability phrase, 12 different versions of the survey were created. In every version, the probability phrase was formulated in a different context and contexts were repeated two or three times in each survey version (since 29 is not divisible by 12). All survey versions were evenly and randomly distributed among the participants by the survey software Qualtrics [ 2005 ].
3.5 Personal characteristics
After giving their interpretation of the 29 phrases, participants were asked for some personal information. This included whether they are a statistician, their highest completed education level, age, and gender. Statisticians were self-reported, and this was questioned as Are you a statistician or do you perform statistical analyses on a weekly or monthly basis? . Education was categorized in six common categories of degrees in the Netherlands. Age was categorized in intervals of 20 years. These wide intervals were chosen to protect the anonymity of the participants and because the exact ages were not of particular interest for this research. However, age was included to check whether both young and older people participated. As with age, gender is not of particular interest for this study, but it was included to check whether participants are almost equally distributed among the genders.
All these characteristics were asked as multiple-choice questions and participants could select one of the given categories. Participants were allowed to refrain from providing their age and gender.
3.6 Pilot
A pilot study showed that the length of the survey was reasonable (approximately ten minutes) and that the explanation was clear. We noticed that some participants had the tendency to base their interpretation of a phrase on their interpretations of previous phrases. This confirmed that randomization of the phrases is necessary. Additionally, it supported our decision to present one phrase at the time and to not allow participants to change their answers to previous questions. If we had permitted this, participants may have ranked their answers instead of giving the interpretations individually, which may have influenced the results. Based on the pilot study, we decided to make the original question Are you a statistician or do you perform statistical analyses on a regular basis? more specific by changing on a regular basis into on a weekly or monthly basis .
3.7 Survey distribution
We obtained permission to distribute this survey from the ethical committee of the Faculty of Behavioural and Social Sciences of the University of Groningen (17451-O). Since we wanted to compare the interpretations of Dutch-speaking statisticians with those of non-statisticians, the survey was distributed among both groups. Statisticians were invited to participate via the mailing list of the Netherlands Society for Statistics and Operations Research (VVSOR) and the Interuniversity Graduate School of Psychometrics and Sociometrics (IOPS). To reach non-statisticians, the survey invitation was distributed via the personal Twitter [Twitter Inc., 2018 ] accounts of the three authors (one of the authors is a public figure and has over 60.000 followers, many of which are not in the academic community). Their followers were asked to participate and to share the survey in their network.
4 Results
4.1 Participants’ characteristics
The survey was open for participation for almost four months, namely between July 18 , 2018 and November 8 , 2018. During this time, 1004 persons started the survey, of which 115 did not finish it. These incomplete observations were removed from the data. Another 8 participants were excluded from the analysis, because their native language was not Dutch. As a result, the data contains the responses of 881 participants.
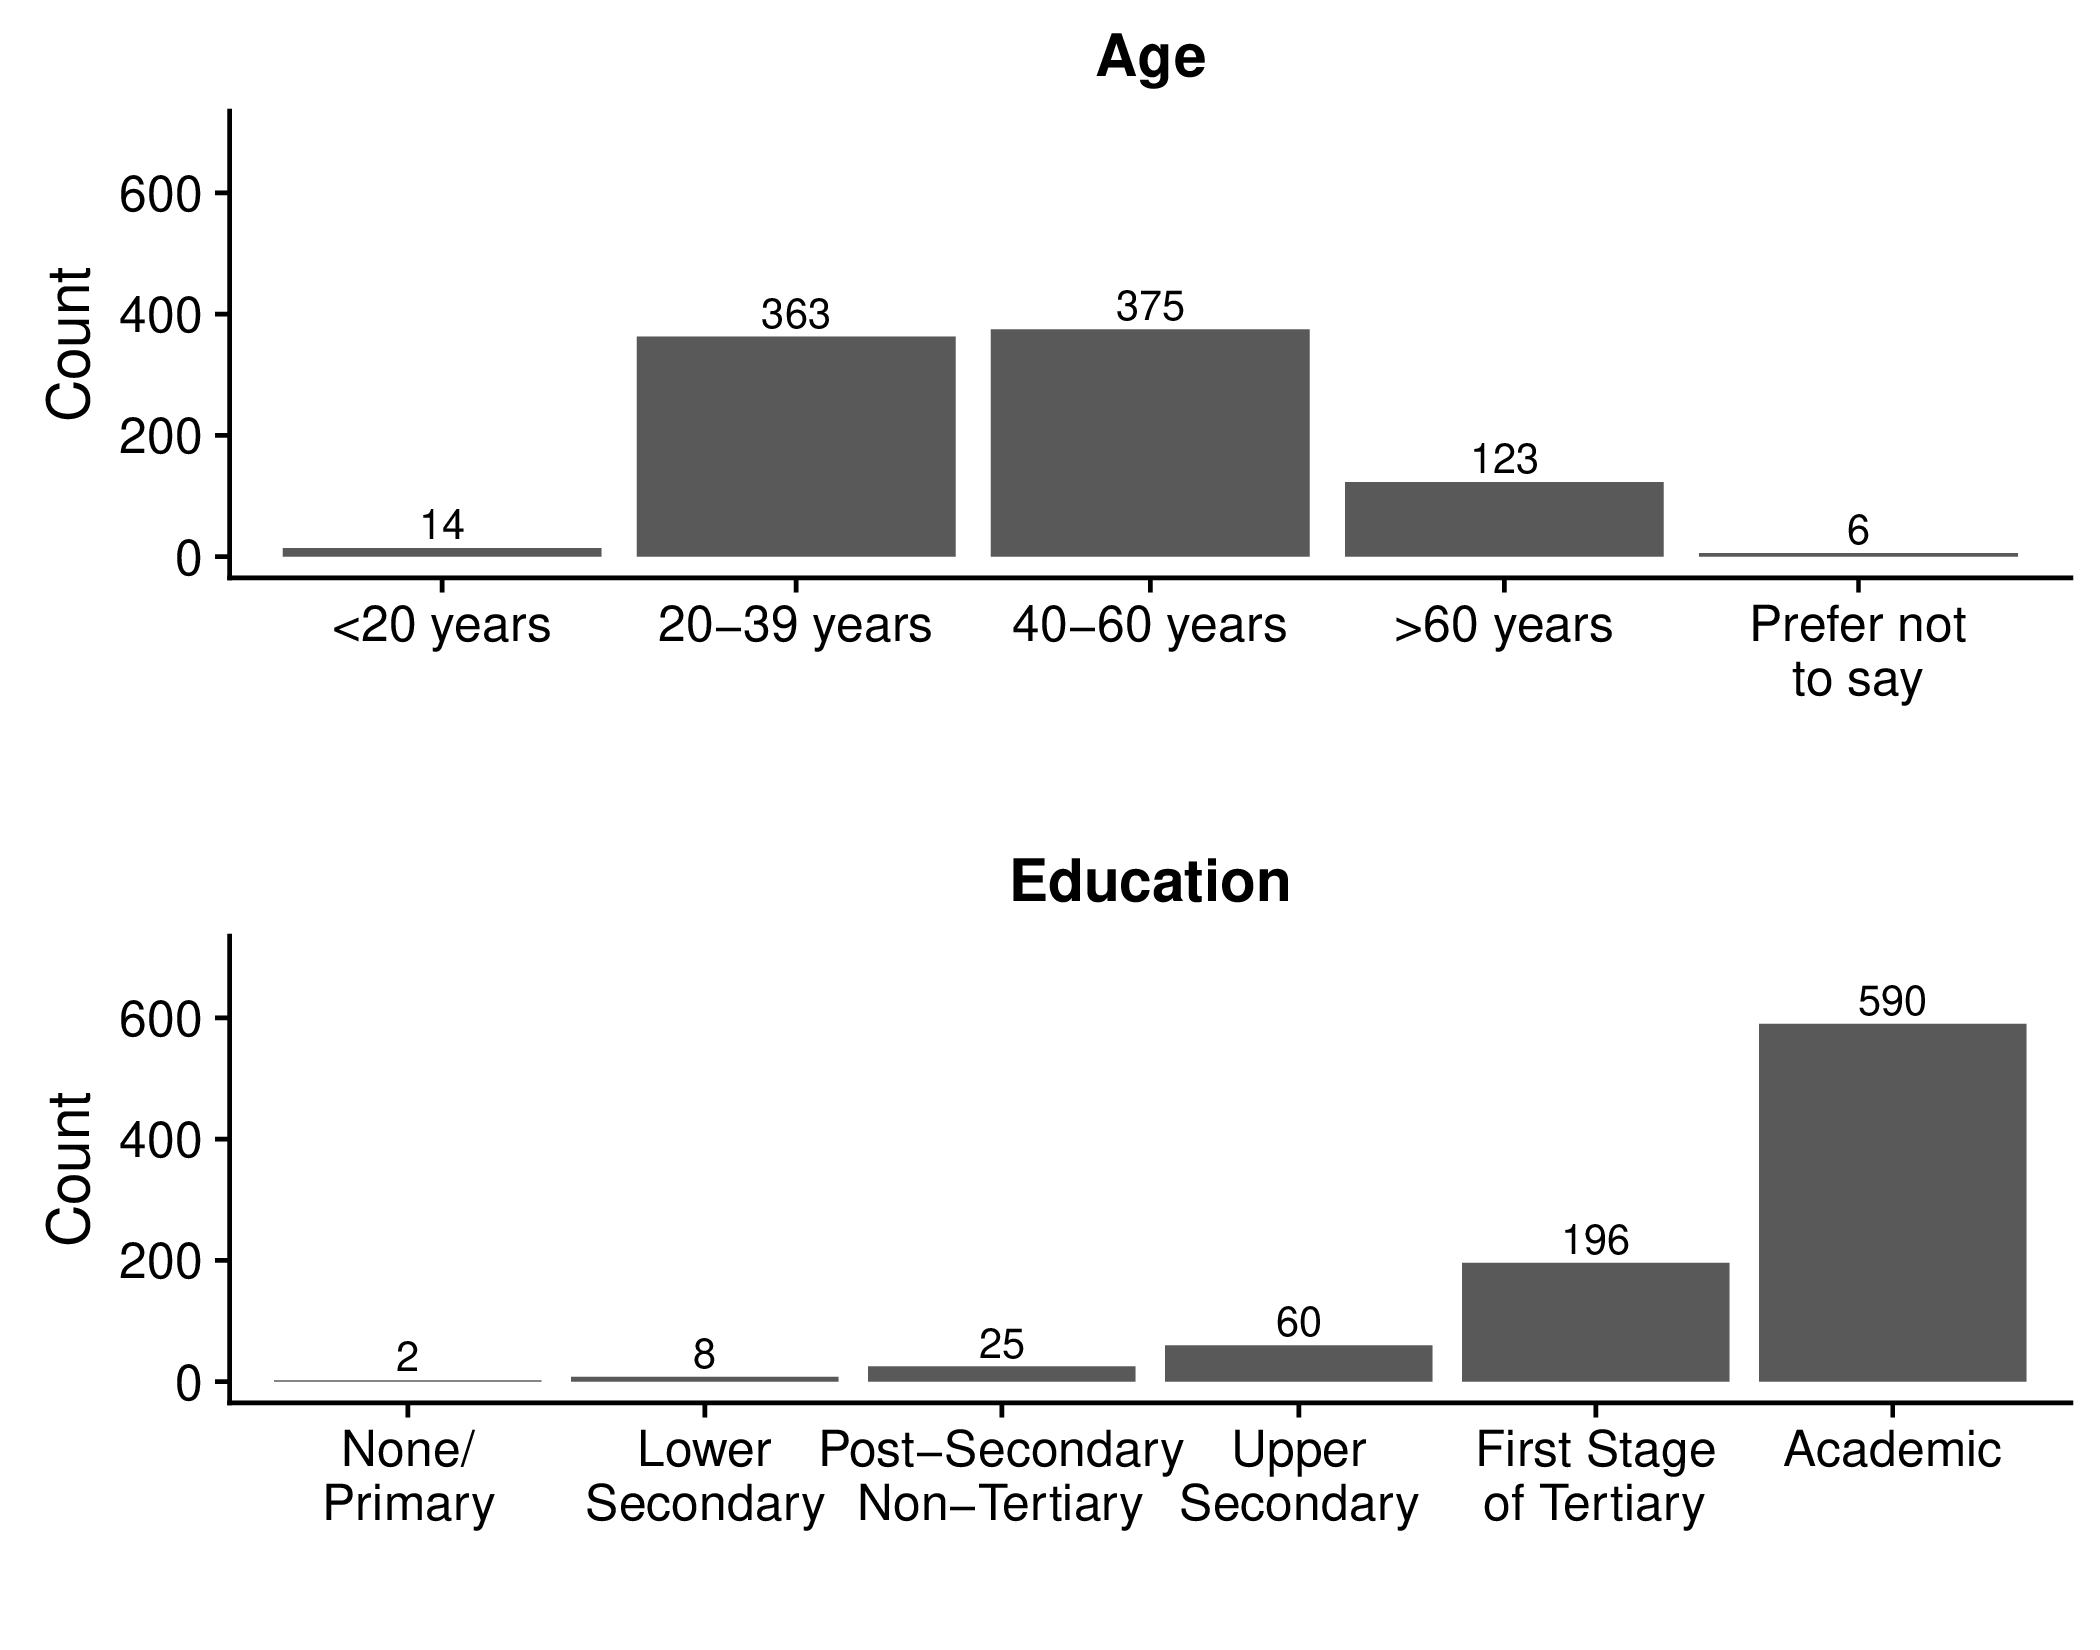
The participants are evenly distributed among the genders (430 male vs. 440 female). There were many more non-statisticians than (self-reported) statisticians (655 vs. 226). Their distribution among the age groups and education levels is displayed in Figure 1 . The first bar plot indicates that most participants were equally distributed among the two middle age groups (20–39 years and 40–60 years). The second bar plot shows that many of the participants were highly educated. Most statisticians have an academic education (94%) and also among the non-statisticians, the proportion of academically educated persons is large (58%). Furthermore, there are more males than females among the statisticians (59% male) and more females among the non-statisticians (55% female).
4.2 Interpretation of probability phrases
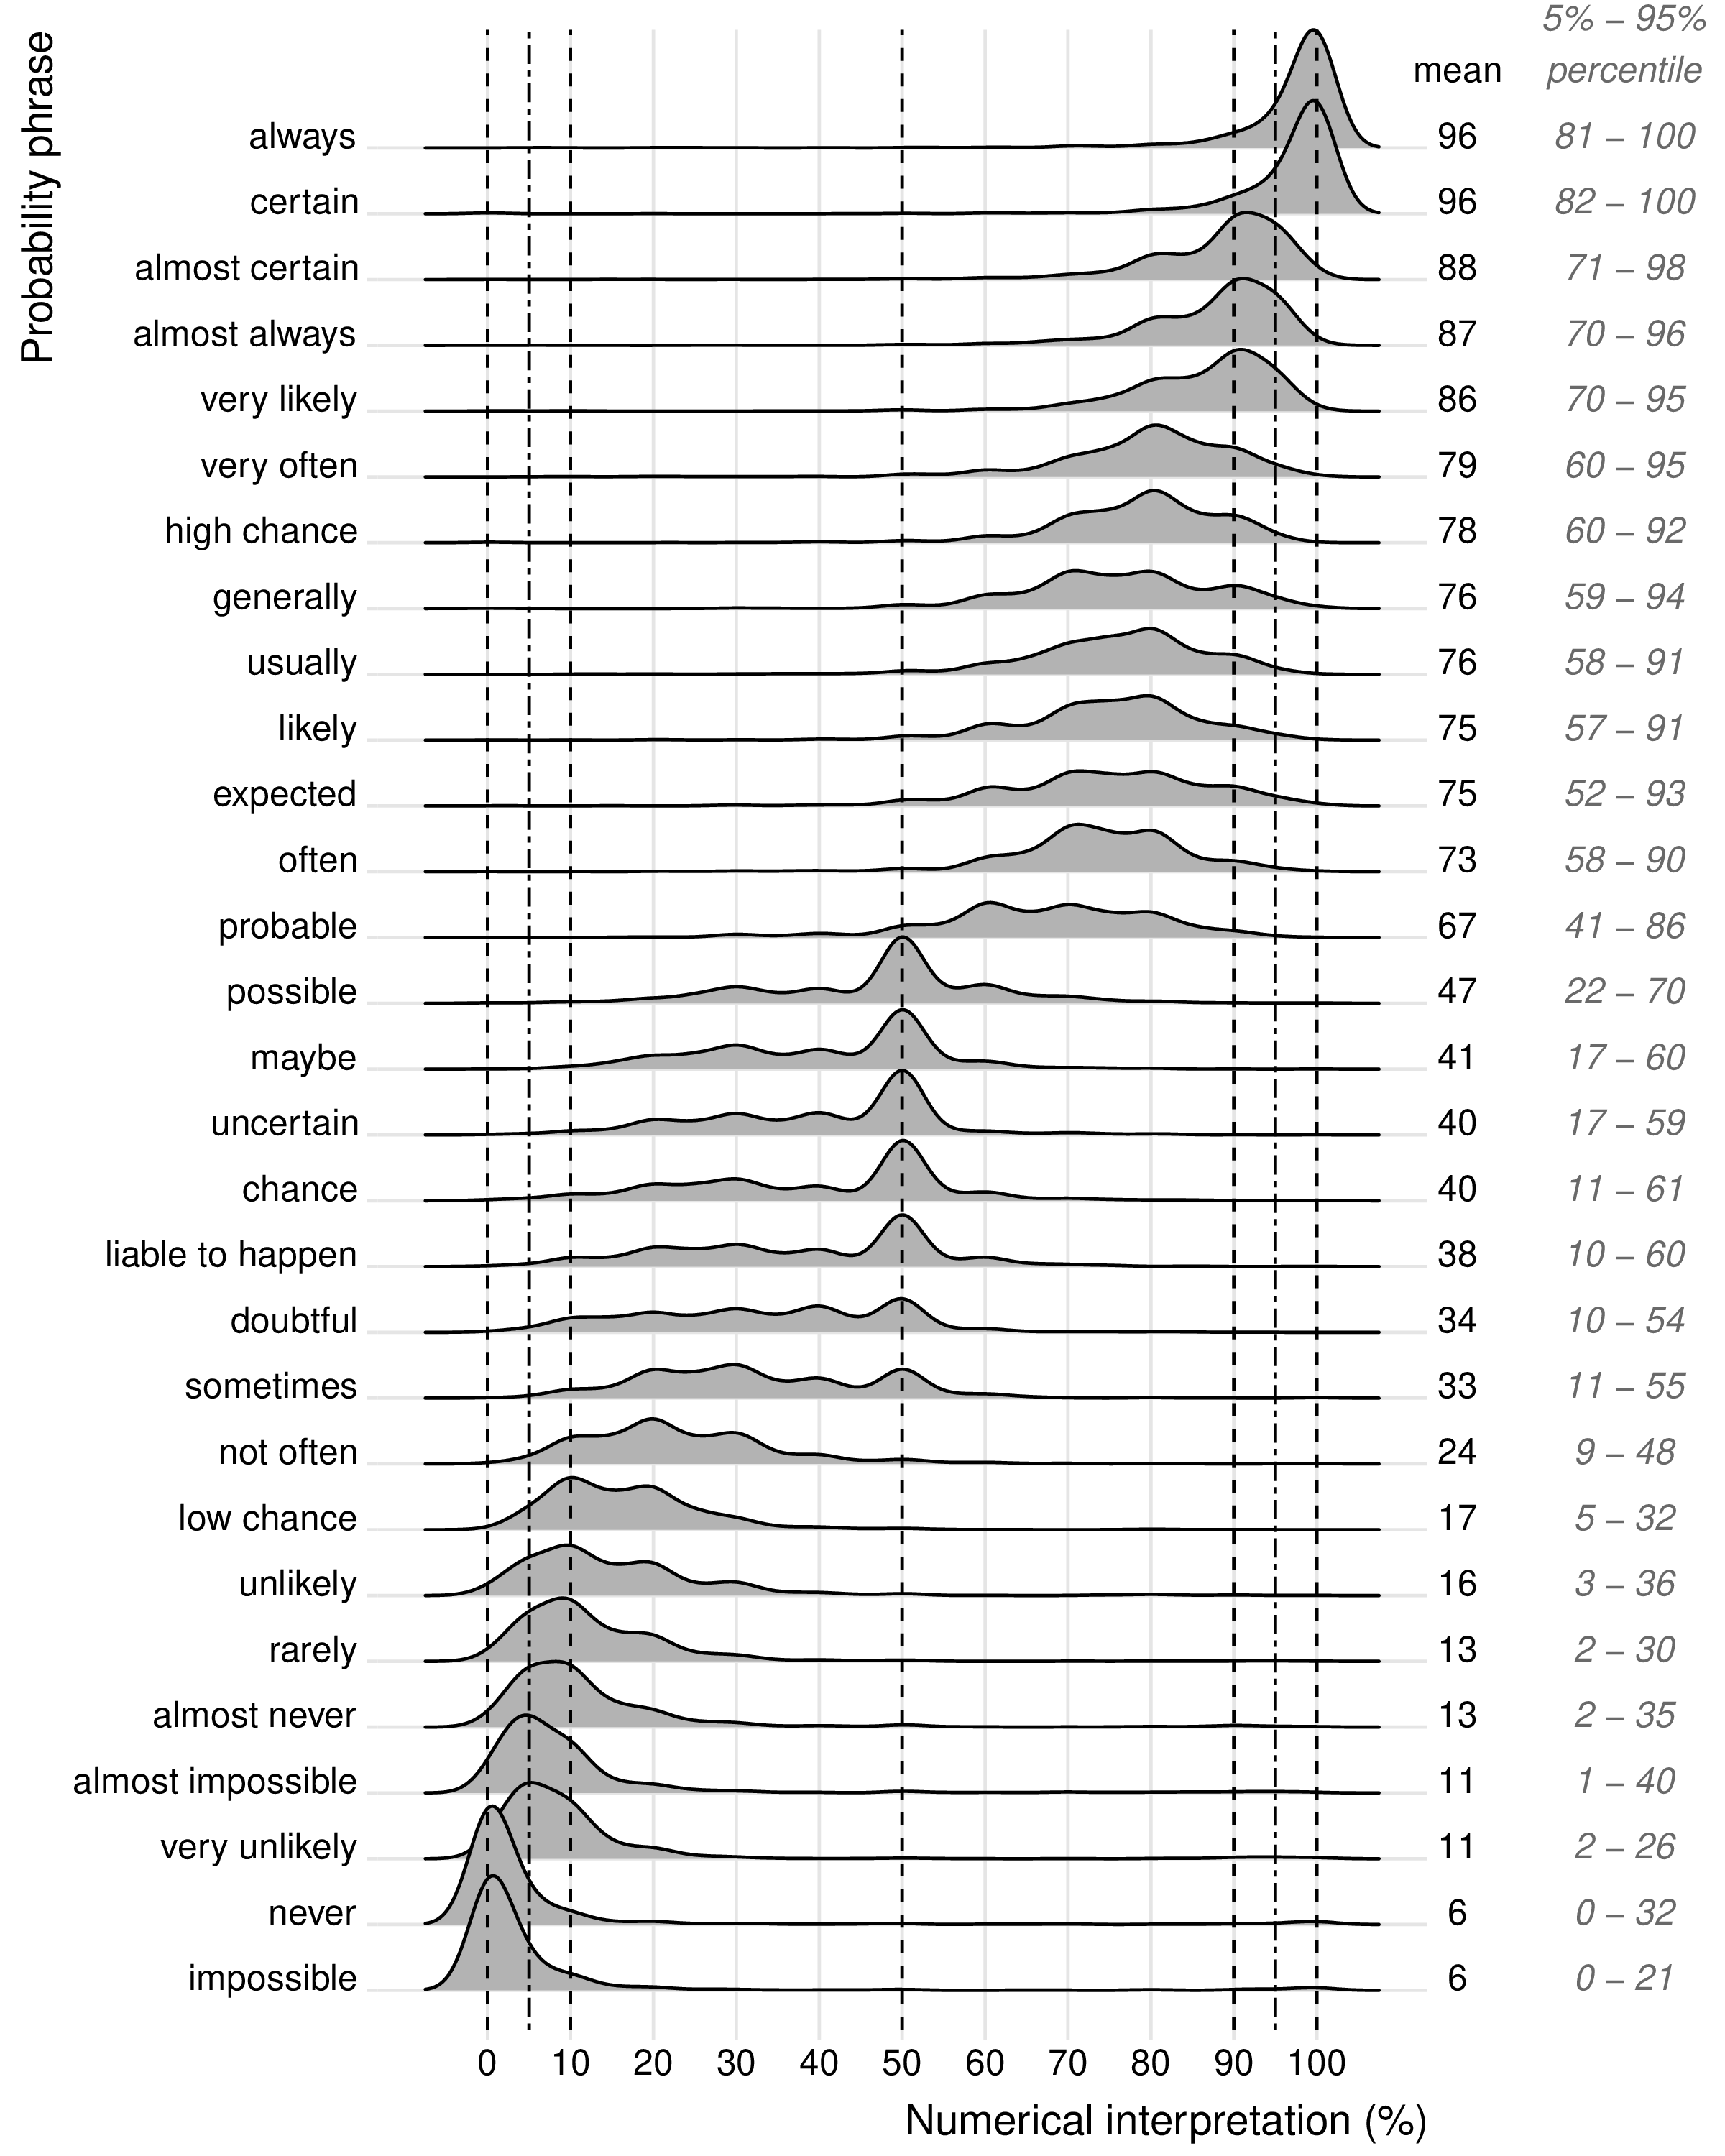
The distributions of the interpreted percentages of each probability phrase are displayed by the density plots in Figure 2 and the mean values and 5% and 95% percentiles are listed on the right side of the plots. The 5% and 95% percentiles indicate the range of interpretations of 90% of the participants.
There seems to be some consensus about the interpretation of extreme words like always , certain , and impossible . Namely, the intervals between their 5% to 95% percentiles have a width of about 20 percentage points. Surprisingly, the 95% percentile of the extreme phrase never is at 32%, which seems high for this expression.
There is even less consensus for phrases that do not represent an extreme probability. Namely, their numerical interpretations have percentile ranges with widths up to 50 percentage points. For example, 90% of the respondents interpreted the verbal probability expressions sometimes , probable , and almost always between, respectively, 11–55%, 41–86%, and 70–96%.
Other things to notice are the small peaks in the density plots which indicate that participants often express probabilities as multiples of ten which results the “heaping” of data at these round numbers. Also, there was no phrase in our survey that represents 50%. The candidates liable to happen , chance , uncertain , maybe , and possible , for which 50% is the most frequently chosen interpretation, all have a large tail to the left and percentile ranges of 42–50 percentage points.
4.3 Asymmetry
For the usability of verbal probability expressions, (a)symmetry in the interpretation of mirrored verbal probability expressions are of interest. The imbalance in their interpretation is often investigated by reviewing whether the group means or group medians of the interpretations of two complementary words sum to 100%. The group means from our data are listed in Figure 2 , and show that, as in English, asymmetry is present for the Dutch translations of likely and unlikely . Namely, the mean interpretation of likely in our data is 75% and the mean for unlikely is 16%, and hence these sum to 91%. Symmetry is found for phrases as very likely and very unlikely (sum to 95%), almost always and almost never (sum to 100%), and often and not often (sum to 97%).
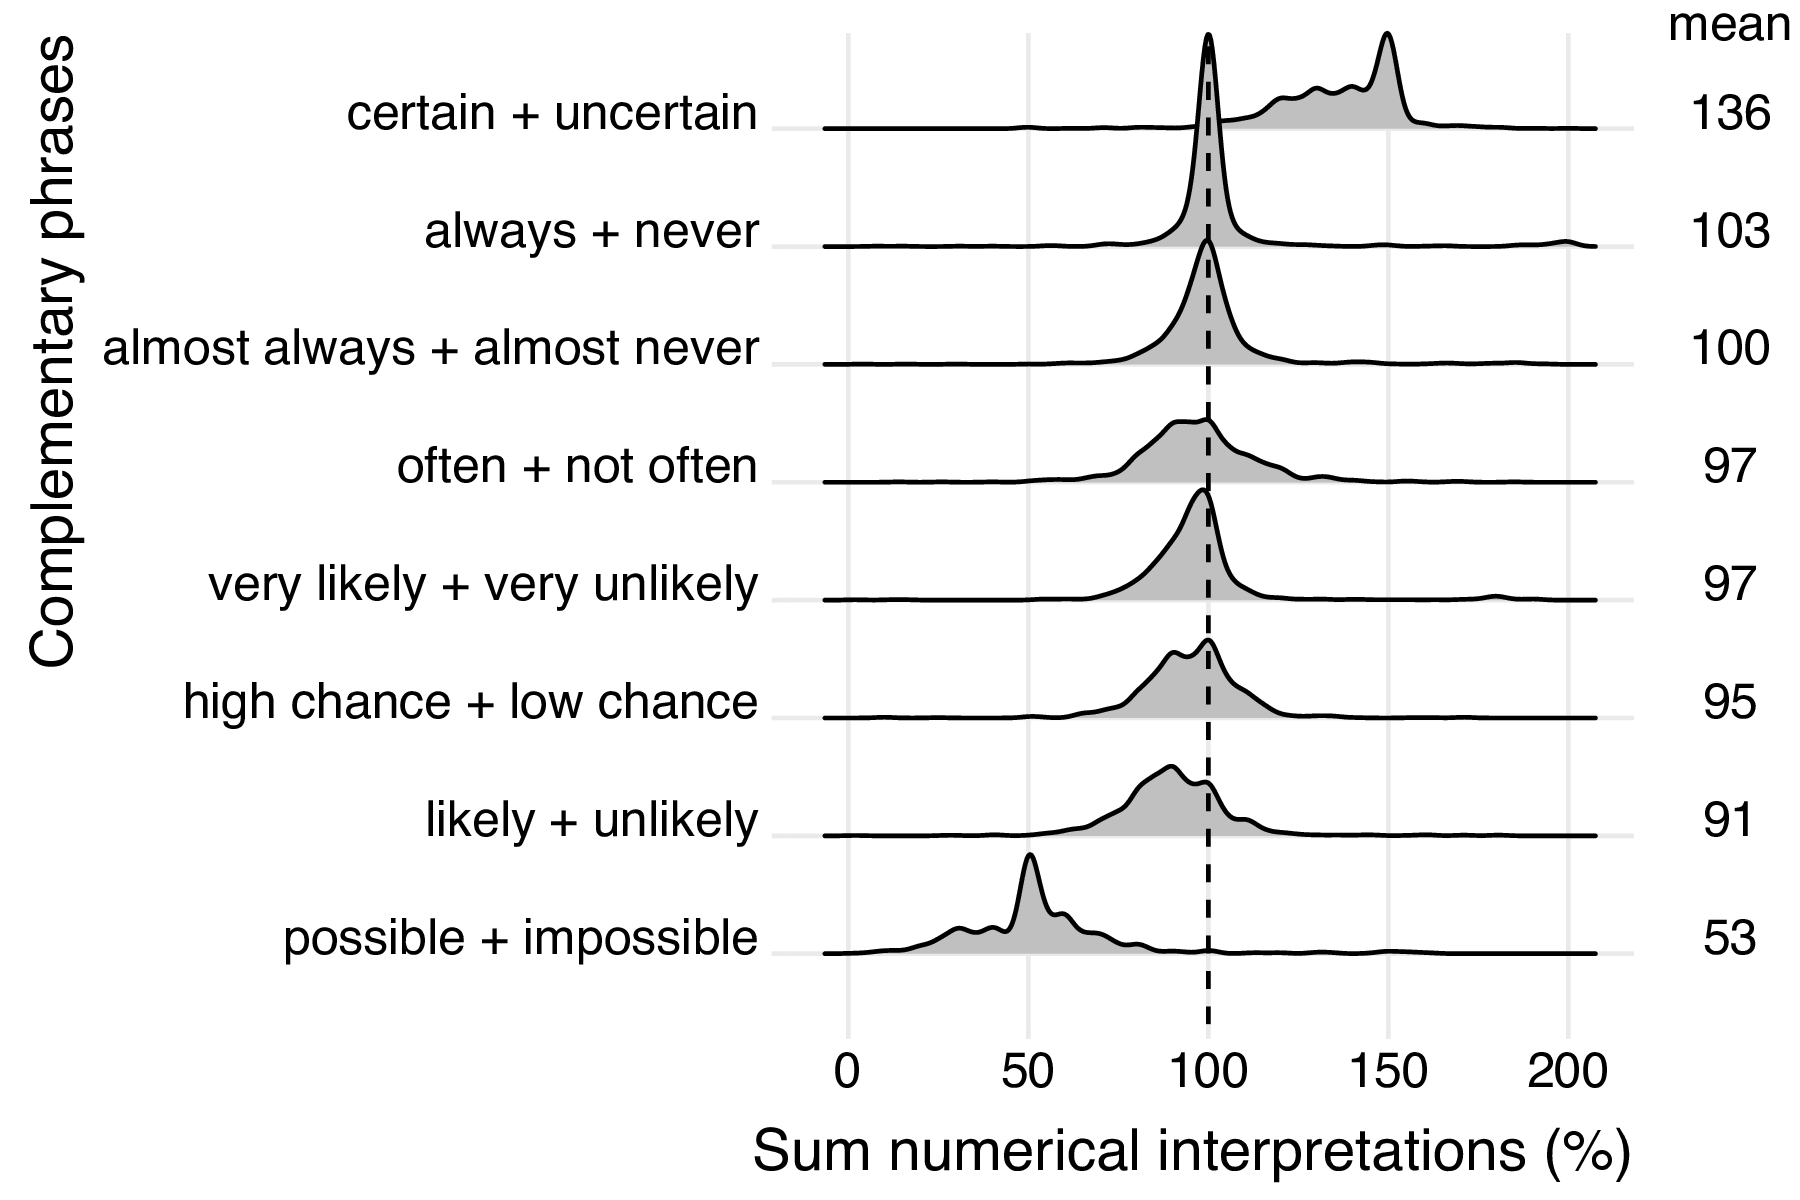
The results from previous studies and those listed above are based on the results at a group level (group means). We also looked at the results on an individual level by plotting the density of the sums of complementary phrases, see Figure 3 . These plots show that there are some mirrored pairs which interpretation sums up to about 100% for most participants, for example (almost) always and (almost) never , and very likely and very unlikely . Other complementary phrases were interpreted asymmetrically by many participants and usually sum up to slightly less than 75% to 100%, for example likely and unlikely , and often and not often .
As explained in the introduction, in some cases asymmetry has a linguistic cause. Our results on the interpretation of possible and impossible confirm the findings of Mosteller and Youtz [ 1990 ]. Namely, Figure 2 shows that impossible has a stable interpretation that is close to 0%, while possible has a broad interpretation from 20% to 70% which peaks around 50%. The asymmetry is also confirmed by the distribution of their sums in Figure 3 .
A similar pattern is found for certain and uncertain ; there is a consensus on the interpretation of certain (around 100%) while the perception of uncertain varies a lot and is comparable to maybe ’s interpretation, namely some value between 20% to 50% (see Figure 2 ). As a result, the percentages of certain and uncertain always sum to more than 100% and together peak at 150% (see Figure 3 ).
4.4 Context
One of our concerns was that the context of the sentences influences the perception of the probability phrases. To avoid the base-rate effect, we tried to formulate the context sentences as neutrally as possible.
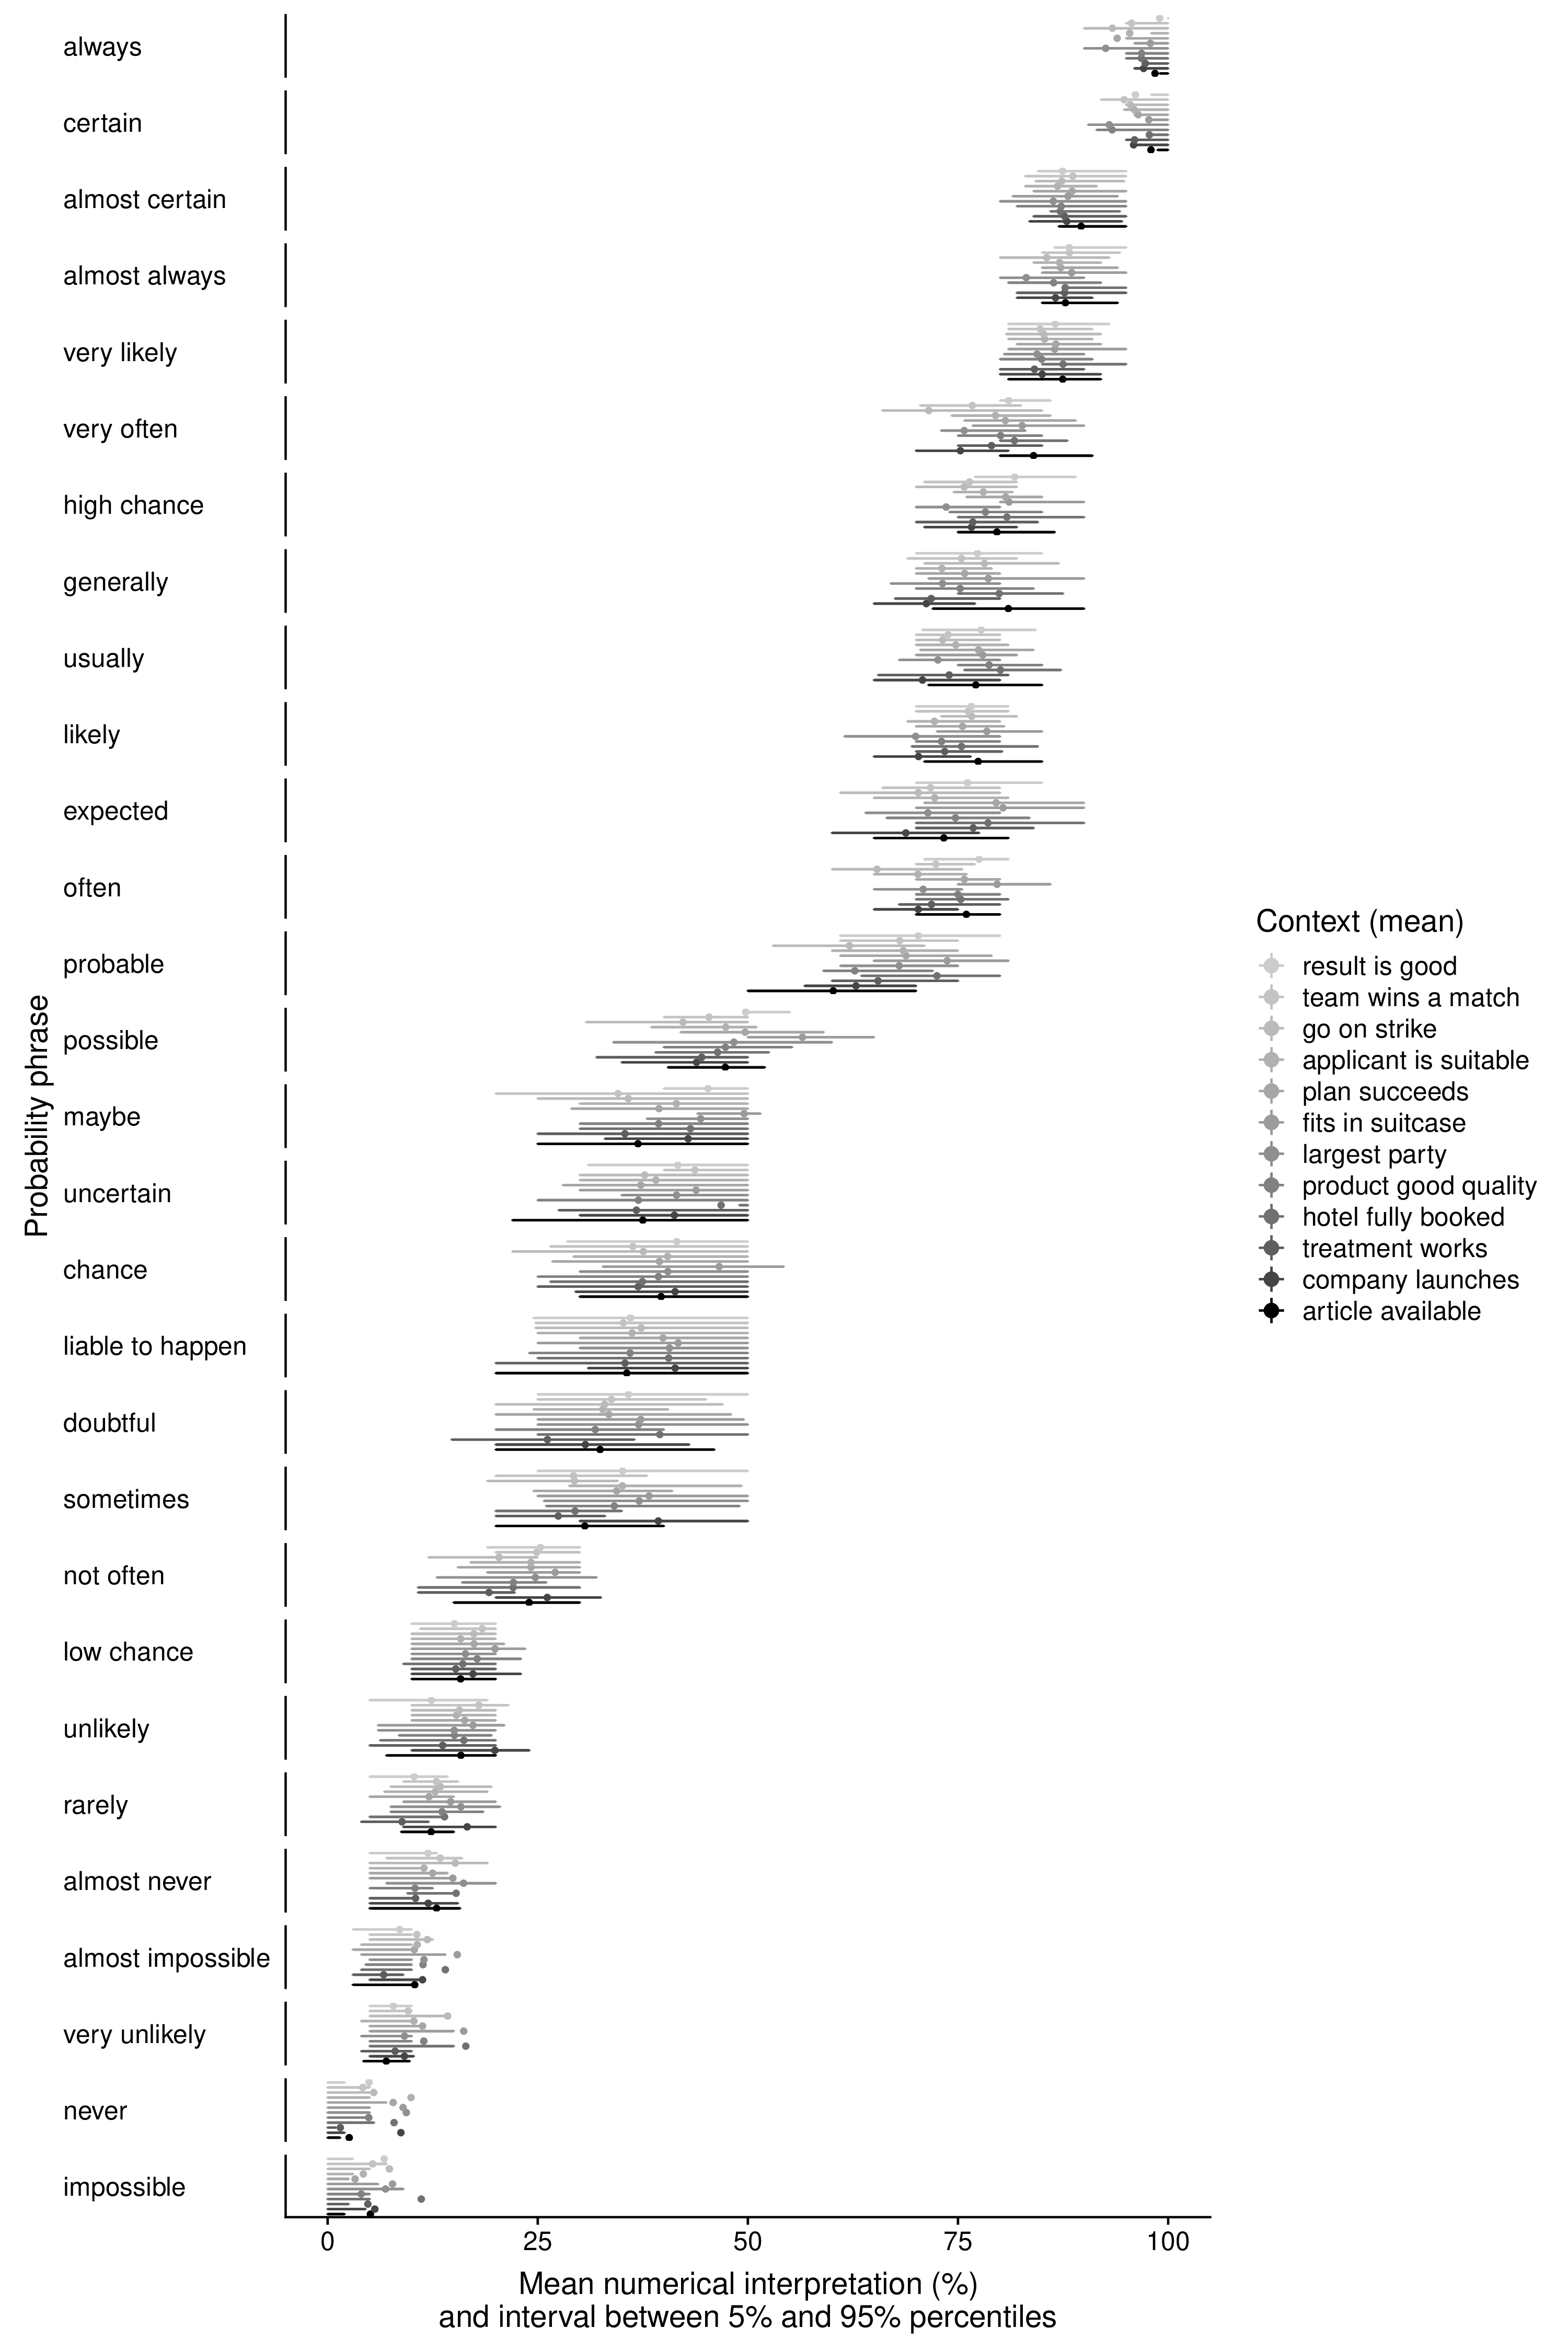
To check whether we succeeded in our intention, we investigated the variability of the interpretation of phrases among different contexts. Figure 4 shows the mean percentages given by the participants to each probability phrase, grouped by context, together with the intervals between the 25% and 75% percentiles. Hence, these intervals indicate the numerical interpretation of a probability phrase of half of the participants and give an indication of the uncertainty around the mean values.
This plot shows that, in general, the means of phrases are very similar for each context, with a maximum of 20 percentage points difference between contexts. Most of this variability appears for words that represent 30% to 80%. This is confirmed by the intervals indicating the uncertainty around these means. The fact that the widths of most intervals are comparable and that the intervals of each context overlaps with the intervals of several other contexts suggests that none of the context sentences is systematically interpreted differently (higher/lower or more/less extreme) from the others. Even the intervals of two phrases that presented a negative outcome ( they will go on strike and this hotel is fully booked) overlap considerably with the intervals of the other context sentences.
4.5 Differences between sub-populations
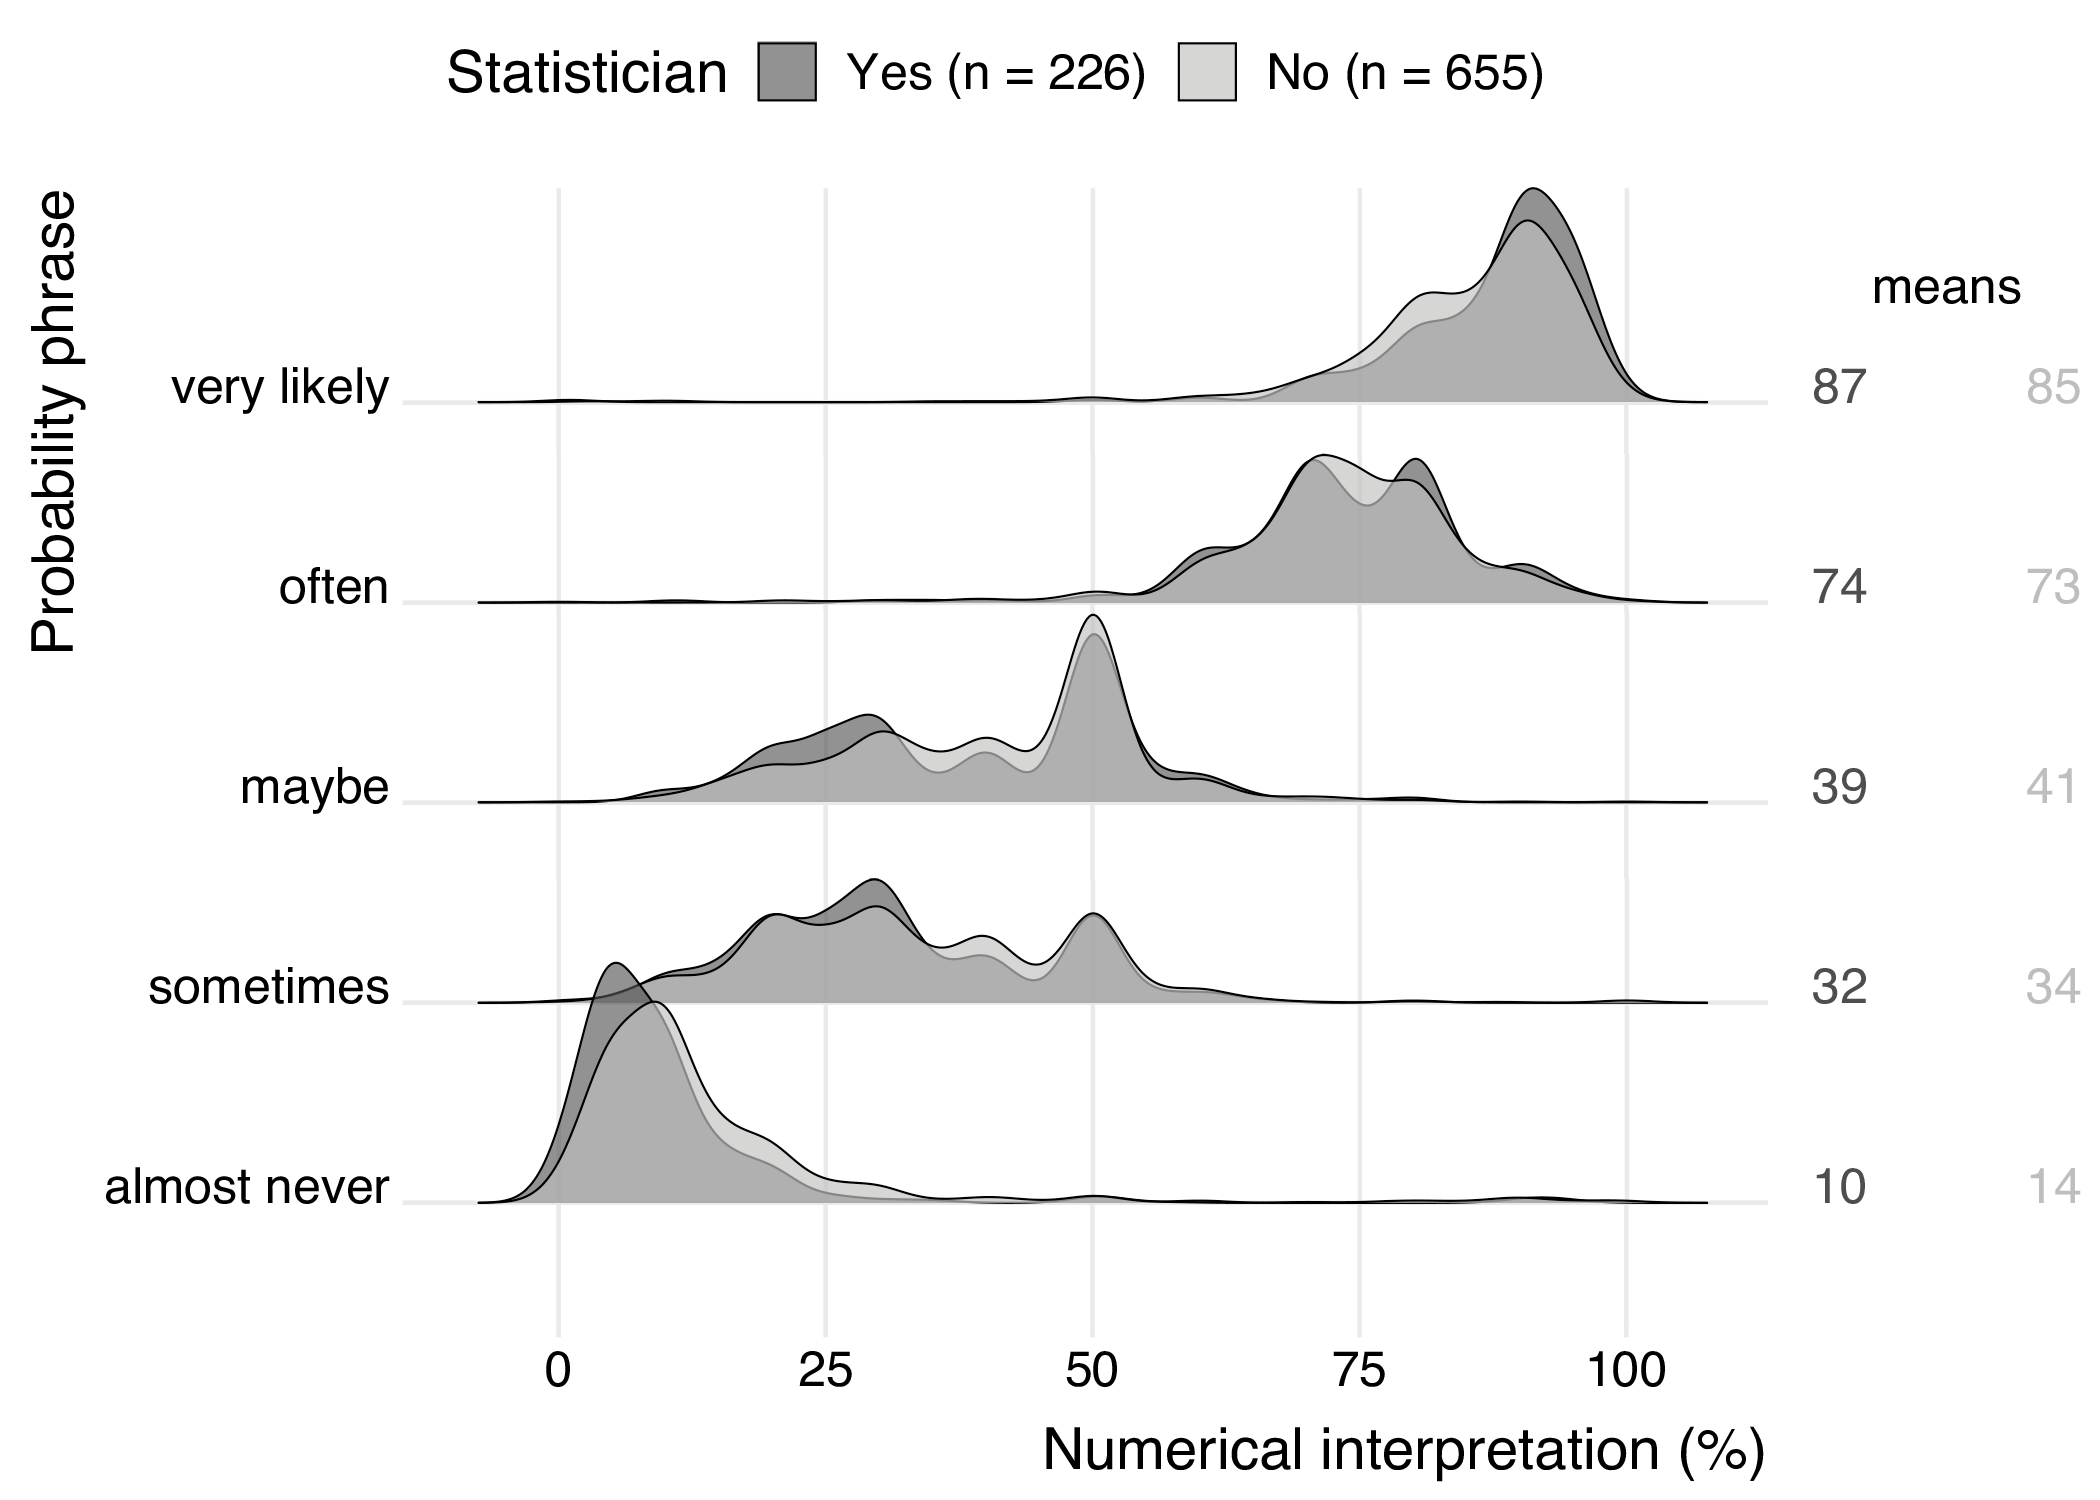
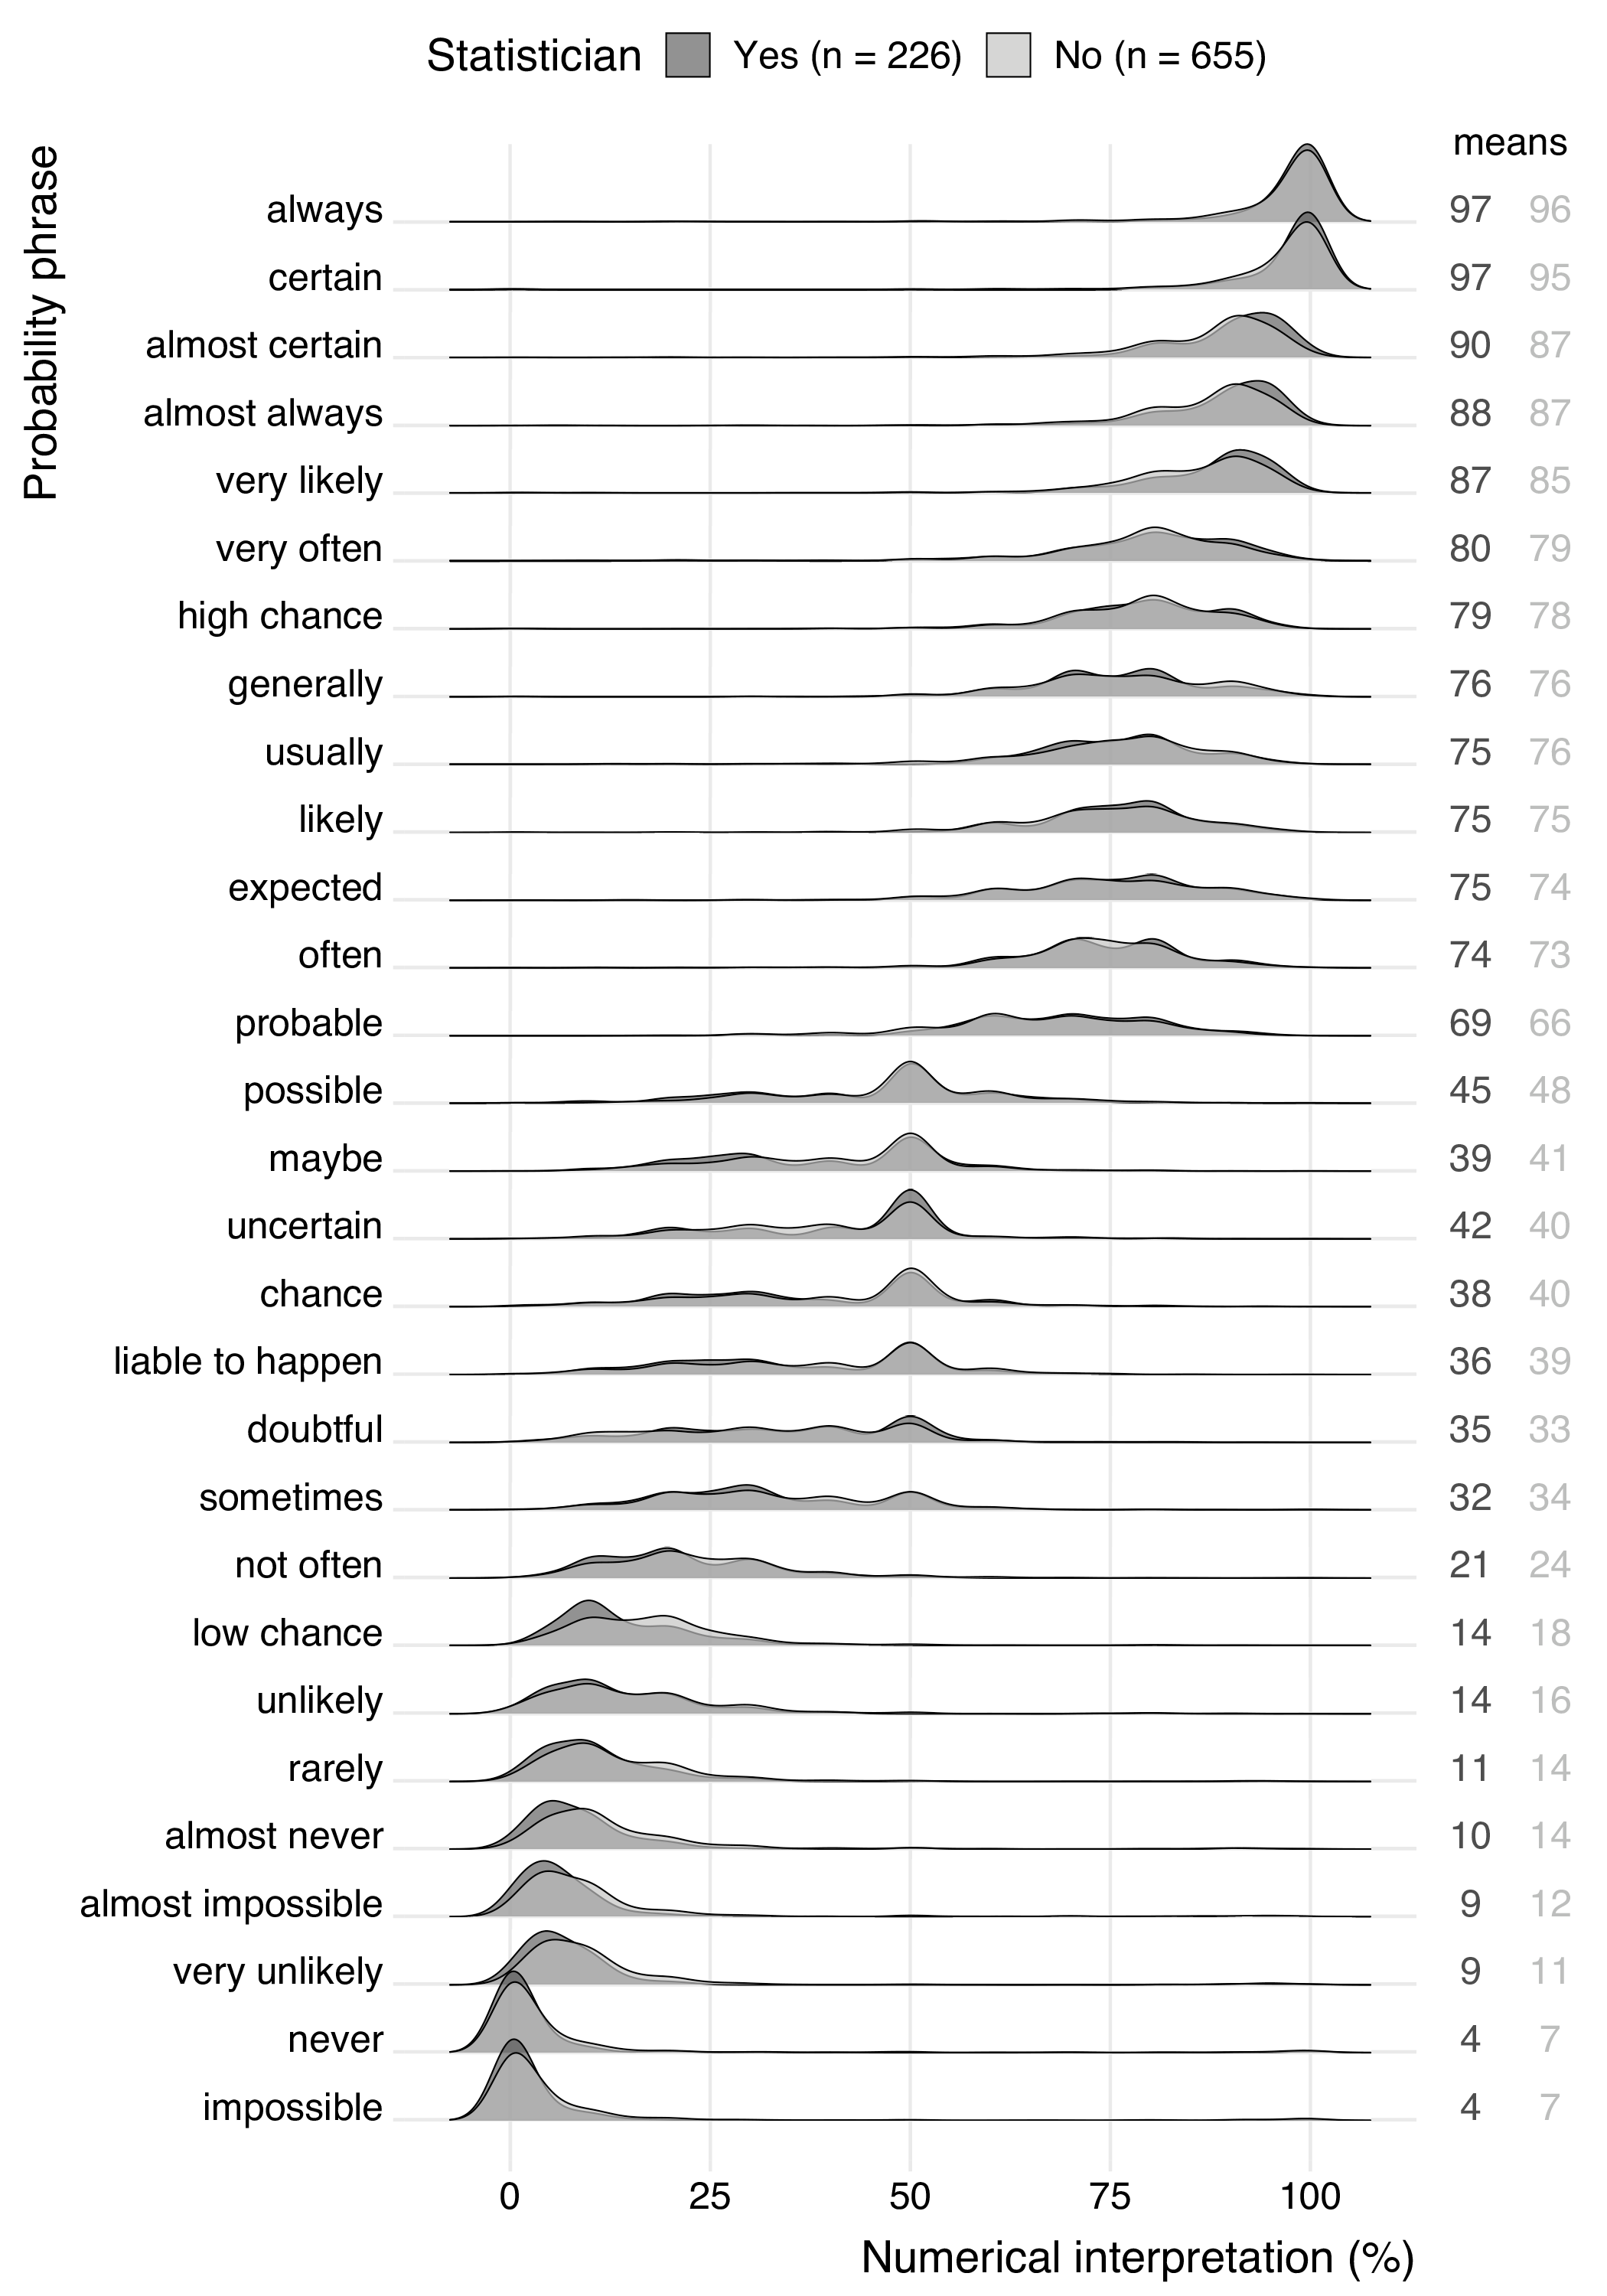
One of the aims of this research was to make a comparison of the interpretation of probability phrases of different sub-populations, namely, to compare interpretations of experts (statisticians) with those of laypeople. Figure 5 shows the density plots of the statisticians and non-statistician for a selection of five probability phrases. These expressions were selected from different ranges of numerical interpretations. Results for all phrases are shown in Figure 6 in appendix C .
These density plots show that the interpretations of the probability phrases are very similar for both statisticians and non-statisticians. This similarity is represented by the overlapping regions of the plots. The non-overlapping regions are relatively small, which suggests that there are no big differences between the groups. This is supported by the group means, since the maximum difference between statisticians and non-statisticians is four percentage points.
Although the differences are small, the density plots of very likely and almost never in Figure 5 may suggest that statisticians agree more on the interpretation of verbal probability expressions expressing an extreme probability. This phenomenon is also seen for other extreme phrases (see Figure 6 in appendix C ), but not for phrases expressing percentages closer to 50%. However, the difference between the group means is small for these phrases, so the group effect (if present) is weak.
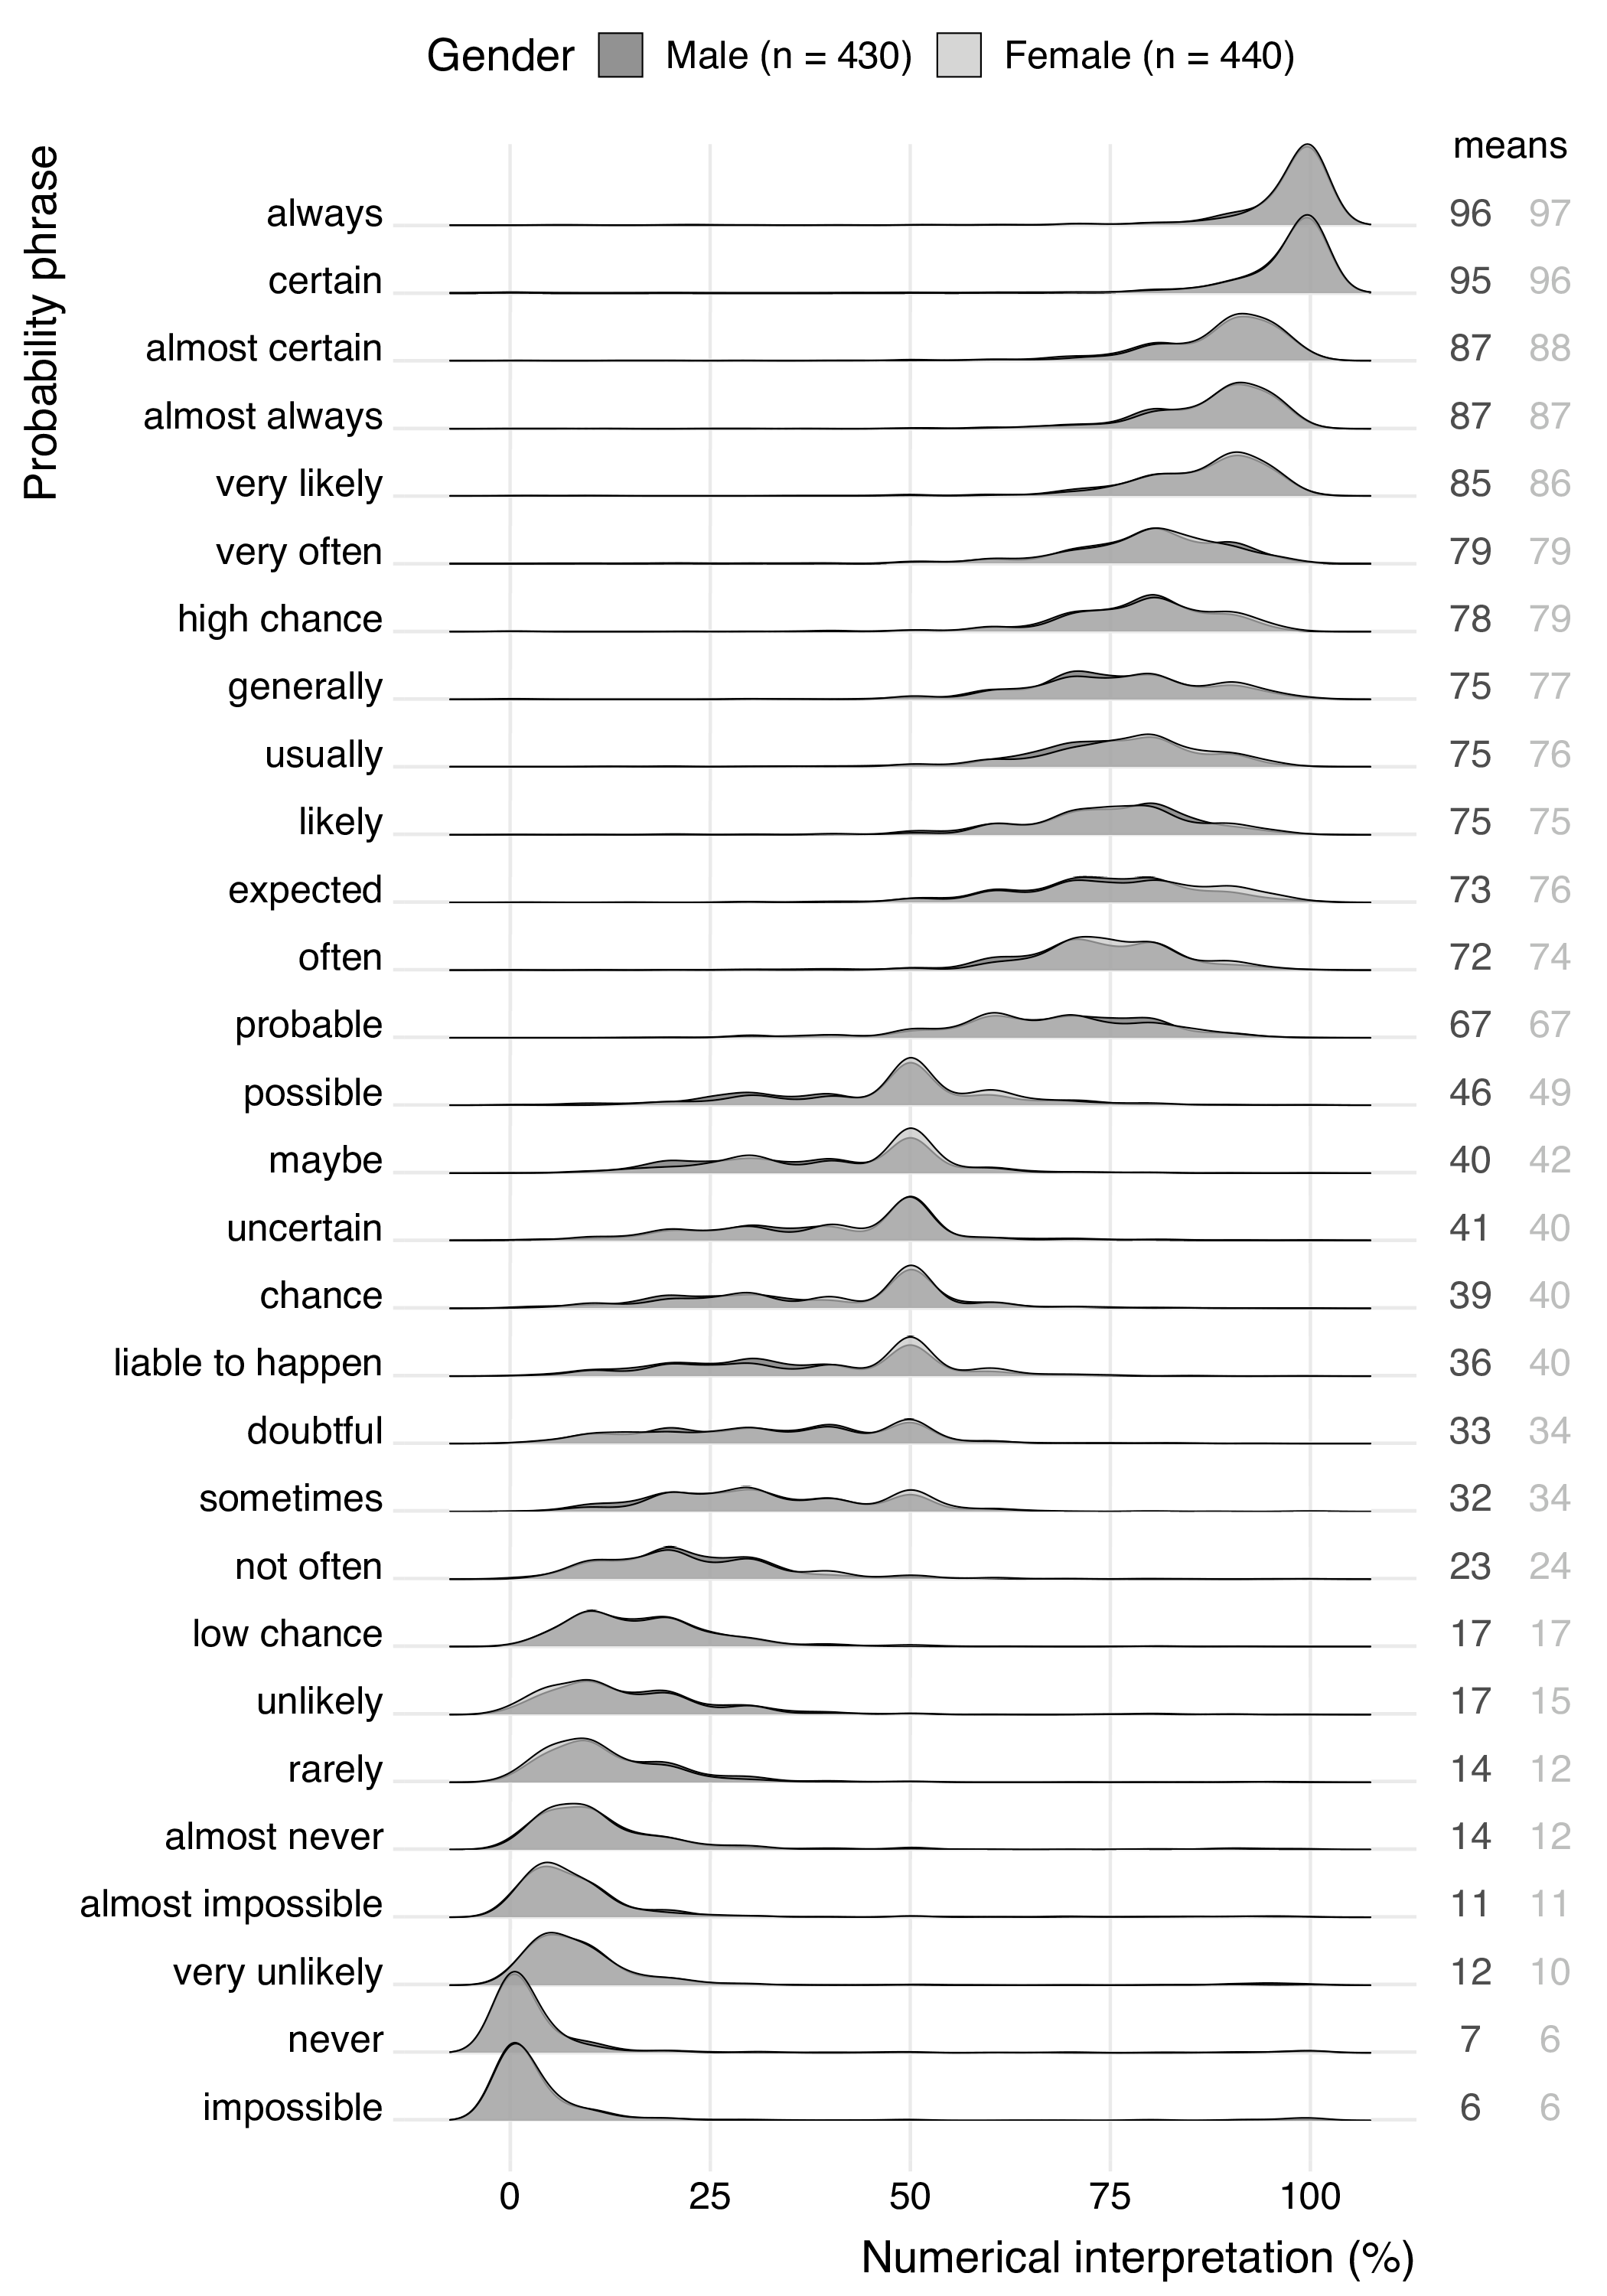
We also investigated whether there were differences in responses by men and women but found no notable differences (see Figure 7 in appendix C ).
Note that we do not statistically test for group differences because the interpretations have very irregular distributions which makes statistical testing complicated.
5 Discussion
In this study we have investigated the variability of the interpretation of Dutch probability and frequency phrases. Such phrases play an important role in science communication, for instance in debates about the risks of climate change or in health communication about the side-effect of medicines. The set-up of our survey was comparable to previous surveys on the interpretation of English phrases, but it filled existing gaps in the research on Dutch probability phrases. For example, we included many Dutch expressions that were not studied before and represented them in a neutral context. Furthermore, we verified asymmetries in the interpretation of mirrored phrases, and checked for differences in interpretation between statisticians and non-statisticians.
Our results showed that, as in English, there is a large variability in the interpretation of Dutch probability and frequency phrases. Although there is some agreement about extreme words as always , certain , never , and impossible , there is no consensus about words that describe a less extreme probability.
As mentioned before, Eekhof, Mol and Pielage [ 1992 ] already studied many Dutch frequency expression. Ten of those were also included in our study so we could compare the results. For nine of these phrases, the mean interpretations differed a maximum of three percentage points. Only the interpretation of sometimes differed more, namely a difference of 8 percentage points (mean of 33% in our study vs. 25% in their study).
Besides comparing our results to those of previous studies in Dutch, we can verify our results with studies that included English counterparts of the phrases in our survey. Theil [ 2002 ] listed the mean interpretations for ten probability phrases found in ten studies, seven of which overlapped with our list of verbal probability expressions. The mean interpretations that we measured for these phrases are all between the lower and upper bounds of the means measured in these ten studies. However, these ranges of those means were quite wide for some expressions. Due to this large amount of variability in the English results, it is not possible to conclude from this that there are no differences between the interpretations of Dutch phrases and their English translations.
Additionally, our data confirms the previous results on asymmetry in the interpretation of verbal probability expressions, also on an individual level. For example, usually an individual’s numerical interpretations of likely and unlikely do not sum to 100%.
Previous studies in English showed that the asymmetry in the interpretation of some mirrored pairs (as possible and impossible , and certain and uncertain ) has a linguistic cause. Our study confirms that similar asymmetries are found for the Dutch translations of these phrases.
Another phenomenon that has previously been shown to have an influence on the interpretations of verbal probability expressions is context, namely the perceived base rate of an event described in the context and its severity [Tversky and Kahneman, 1981 ; Wallsten, Fillenbaum and Cox, 1986 ; Weber and Hilton, 1990 ]. Therefore, we tried to present the expressions in neutral contexts. Although the mean interpretations varied among the contexts (see Figure 4 ), our results did not show a systematic difference between contexts. This was also confirmed by the considerable overlap of the intervals between the 25% and 75% percentiles of the numerical interpretation of each combination of probability phrase and context. From this we can conclude that there were probably no strong base-rate effects, indicating that our chosen contexts were neutral enough.
Only after analysing our data we realized that of the twelve contexts that we used, ten presented a positive outcome (for example this treatment will work and this plan succeeds ), but two presented a negative outcome (namely they will go on strike and this hotel is fully booked ). Phrasing a risk positively or negatively may also influence interpretation. However, we found no systematic differences between the mean interpretations and the percentile intervals of these positive and negative contexts.
To test for differences in interpretations between experts and laypeople this survey was distributed among both statisticians and non-statisticians. Our data showed large variability within each group and no systematic differences between them. Hence, it seems that regularly making and communicating probability estimations does not increase agreement about the interpretations of probability expressions. This justifies our analyses on the complete sample.
The size of the complete sample (881 participants) is one of the strengths of this study. In most studies sample sizes were quite small; the mean number of participants in the previous Dutch studies listed in this article was 93 and, for example, in the English studies mentioned by Theil [ 2002 ] it was 170.
Participants were invited via Twitter, which is a convenient way to reach a lot of people. Various other academic studies have resorted to Twitter or other social media to recruit participants [Jones et al., 2012 ; Hamed, Wu and Rubin, 2014 ]. However, according to Blank [ 2017 ], Twitter users are more likely to be younger, higher educated, students or employed, single and wealthier. So, although Twitter is an attractive medium to recruit participants, the results from the sample may not generalize to the entire population. Although not generalizable to the whole population, Twitter and other social media have been shown to be useful recruitment methods for research for hard-to-reach populations [Martinez et al., 2014 ; Ramo and Prochaska, 2012 ; Shere, Zhao and Koren, 2014 ].
The bias in Twitter users is confirmed by the large proportion of highly educated people in our sample (see Figure 1 ). Hence, our results on the non-statisticians may not generalize to the entire Dutch-speaking population. However, the results from this study are still valuable, since they showed that, even within this homogeneous sample, interpretations of probability expressions differed enormously. This indicates that interpretations are dissimilar even among more like-minded persons. If the sample had been more heterogeneous, the interpretations may have varied even more.
Although it was generally believed that information providers prefer to express probabilities verbally, a solution might be to convey estimated risks using either numerical values instead of verbal expressions, or both. This may prevent the intended probability from getting lost in its translation from one language to another and may therefore be a solution to this problem.
Recently, studies have been done on this topic. Budescu, Por et al. [ 2014 ] studied a communication format in which the verbal terms and their numerical ranges are shown simultaneously and concluded that this format was highly beneficial, because the range of values associated with the probability terms was reduced and was more in correspondence with the intended probabilities. Furthermore, the joint presentation format made the meaning of the terms more similar across languages, which is important when documents are translated from one language to another. However, a later study by Jenkins, Harris and Lark [ 2018 ] concluded that the order (either verbal-numeric or numeric-verbal) may influence the interpretation of a verbal probability expression. Furthermore, Wintle et al. [ 2019 ] studied four different methods of presenting numeric probabilities along with a verbal probability expression online, namely between brackets in text, click to see probability table in new window, mouse over tool tip to show numerical guidelines, or no guidelines (control group), and found that numerical values between brackets were the most effective. So, in line with this we would advise science communicators to always complement verbal probabilities with the numerical values.
6 Conclusion
Data on the interpretation of 29 Dutch probability phrases was collected from 881 participants, both statisticians and non-statisticians. This data shows that the interpretations of Dutch verbal probability expressions are comparable to those of their English translations. Therefore, all challenges regarding communicating with English verbal probability expressions also apply in Dutch. For example, making a translation table from Dutch verbal probability phrases to numeric values is difficult.
The data also showed that there are no systematic differences in interpretation between statisticians and non-statisticians, and that even among the latter group there is no agreement on the interpretation of the studied phrases.
Since research on this topic is still in progress, we would advise to keep an eye open for them. Current research provides some starting recommendations to science communicators such as providing numerical interpretations between brackets instead of separate probability tables that people rarely look at. Hopefully an optimal mode of presentation of estimated probabilities will be found that minimizes the risks of miscommunication.
A Translations of probability phrases
B Context sentences
C Differences between sub-populations
References
-
Blank, G. (2017). ‘The digital divide among Twitter users and its implications for social research’. Social Science Computer Review 35 (6), pp. 679–697. https://doi.org/10.1177/0894439316671698 .
-
Boyle, C. M. (1970). ‘Difference between patients’ and doctors’ interpretation of some common medical terms’. BMJ 2 (5704), pp. 286–289. https://doi.org/10.1136/bmj.2.5704.286 .
-
Bryant, G. D. and Norman, G. R. (1980). ‘Expressions of probability: words and numbers’. New England Journal of Medicine 302 (7), pp. 411–411. https://doi.org/10.1056/nejm198002143020717 .
-
Budescu, D. V., Por, H.-H., Broomell, S. B. and Smithson, M. (2014). ‘The interpretation of IPCC probabilistic statements around the world’. Nature Climate Change 4 (6), pp. 508–512. https://doi.org/10.1038/nclimate2194 .
-
Budescu, D. V. and Wallsten, T. S. (1985). ‘Consistency in interpretation of probabilistic phrases’. Organizational Behavior and Human Decision Processes 36 (3), pp. 391–405. https://doi.org/10.1016/0749-5978(85)90007-x .
-
Castro, C. M., Wilson, C., Wang, F. and Schillinger, D. (2007). ‘Babel babble: physicians’ use of unclarified medical jargon with patients’. American Journal of Health Behavior 31 (1), pp. 85–95. https://doi.org/10.5993/ajhb.31.s1.11 .
-
Davidson, R. A. and Chrisman, H. H. (1994). ‘Translations of uncertainty expressions in Canadian accounting and auditing standards’. Journal of International Accounting, Auditing and Taxation 3 (2), pp. 187–203. https://doi.org/10.1016/1061-9518(94)90016-7 .
-
Doupnik, T. S. and Richter, M. (2003). ‘Interpretation of uncertainty expressions: a cross-national study’. Accounting, Organizations and Society 28 (1), pp. 15–35. https://doi.org/10.1016/s0361-3682(02)00010-7 .
-
Druzdzel, M. J. (1989). Verbal uncertainty expressions: literature review . Technical report. URL: http://www.pitt.edu/~druzdzel/abstracts/verbal.html .
-
Eekhof, J. A. H., Mol, S. S. L. and Pielage, J. C. (1992). ‘Is doorgaans vaker dan dikwijls; of hoe vaak is soms?’ Nederlands Tijdschrift Voor Geneeskunde 136 (1), p. 41. URL: https://www.ntvg.nl/artikelen/doorgaans-vaker-dan-dikwijls-hoe-vaak-soms/ingezonden-mededelingen .
-
Erev, I. and Cohen, B. L. (1990). ‘Verbal versus numerical probabilities: efficiency, biases and the preference paradox’. Organizational Behavior and Human Decision Processes 45 (1), pp. 1–18. https://doi.org/10.1016/0749-5978(90)90002-q .
-
European Food Safety Authority, Hart, A., Maxim, L., Siegrist, M., da Cruz, C. and Merten, C. (2019). ‘Outcome of the public consultation on the draft guidance on communication of uncertainty in scientific assessments’. EFSA Supporting Publications 16 (1), pp. 1–73. https://doi.org/10.2903/sp.efsa.2019.EN-1540 .
-
Google (2018). Google translate . URL: https://translate.google.com .
-
Hamed, A. A., Wu, X. and Rubin, A. (2014). ‘A Twitter recruitment intelligent system: association rule mining for smoking cessation’. Social Network Analysis and Mining 4 (1). https://doi.org/10.1007/s13278-014-0212-6 .
-
Harris, A. J. L., Corner, A., Xu, J. and Du, X. (2013). ‘Lost in translation? Interpretations of the probability phrases used by the Intergovernmental Panel on Climate Change in China and the U.K.’ Climatic Change 121 (2), pp. 415–425. https://doi.org/10.1007/s10584-013-0975-1 .
-
Jenkins, S. C., Harris, A. J. L. and Lark, R. M. (2018). ‘Understanding ‘unlikely (20% likelihood)’ or ‘20% likelihood (unlikely)’ outcomes: the robustness of the extremity effect’. Journal of Behavioral Decision Making 31 (4), pp. 572–586. https://doi.org/10.1002/bdm.2072 .
-
Jones, L., Saksvig, B. I., Grieser, M. and Young, D. R. (2012). ‘Recruiting adolescent girls into a follow-up study: benefits of using a social networking website’. Contemporary Clinical Trials 33 (2), pp. 268–272. https://doi.org/10.1016/j.cct.2011.10.011 .
-
Juanchich, M. and Sirota, M. (2019). ‘Do people really prefer verbal probabilities?’ Psychological Research . https://doi.org/10.1007/s00426-019-01207-0 .
-
Knapp, P., Raynor, D. K. and Berry, D. C. (2004). ‘Comparison of two methods of presenting risk information to patients about the side effects of medicines’. Quality and Safety in Health Care 13 (3), pp. 176–180. https://doi.org/10.1136/qshc.2003.009076 .
-
Lichtenstein, S. and Newman, J. R. (1967). ‘Empirical scaling of common verbal phrases associated with numerical probabilities’. Psychonomic Science 9 (10), pp. 563–564. https://doi.org/10.3758/bf03327890 .
-
MacLeod, A. and Pietravalle, S. (2017). ‘Communicating risk: variability of interpreting qualitative terms’. EPPO Bulletin 47 (1), pp. 57–68. https://doi.org/10.1111/epp.12367 .
-
Martinez, O., Wu, E., Shultz, A. Z., Capote, J., Rios, J. L., Sandfort, T., Manusov, J., Ovejero, H., Carballo-Dieguez, A., Chavez Baray, S., Moya, E., López Matos, J., DelaCruz, J. J., Remien, R. H. and Rhodes, S. D. (2014). ‘Still a hard-to-reach population? Using social media to recruit latino gay couples for an HIV intervention adaptation study’. Journal of Medical Internet Research 16 (4), e113. https://doi.org/10.2196/jmir.3311 .
-
Mosteller, F. and Youtz, C. (1990). ‘Quantifying probabilistic expressions’. Statistical Science 5 (1), pp. 32–34. https://doi.org/10.1214/ss/1177012251 .
-
Pander Maat, H. and Klaassen, R. (1996). ‘De invloed van de formulering van informatie over bijwerkingen op interpretaties door patiënten en op gemelde bijwerkingen’. Nederlands Tijdschrift Voor Geneeskunde 140 (8), pp. 424–427. URL: https://www.ntvg.nl/artikelen/de-invloed-van-de-formulering-van-informatie-over-bijwerkingen-op-interpretaties-door .
-
Qualtrics (2005). Qualtrics webpage . URL: https://www.qualtrics.com/ .
-
Ramo, D. E. and Prochaska, J. J. (2012). ‘Broad reach and targeted recruitment using Facebook for an online survey of young adult substance use’. Journal of Medical Internet Research 14 (1), e28. https://doi.org/10.2196/jmir.1878 .
-
Reagan, R. T., Mosteller, F. and Youtz, C. (1989). ‘Quantitative meanings of verbal probability expressions’. Journal of Applied Psychology 74 (3), pp. 433–442. https://doi.org/10.1037/0021-9010.74.3.433 .
-
Renooij, S. and Witteman, C. (1999). ‘Talking probabilities: communicating probabilistic information with words and numbers’. International Journal of Approximate Reasoning 22 (3), pp. 169–194. https://doi.org/10.1016/s0888-613x(99)00027-4 .
-
Shere, M., Zhao, X. Y. and Koren, G. (2014). ‘The role of social media in recruiting for clinical trials in pregnancy’. PLoS ONE 9 (3), e92744. https://doi.org/10.1371/journal.pone.0092744 .
-
Stheeman, S. E., Mileman, P. A., van ’t Hof, M. A. and van der Stelt, P. F. (1993). ‘Blind chance? An investigation into the perceived probabilities of phrases used in oral radiology for expressing chance.’ Dentomaxillofacial Radiology 22 (3), pp. 135–139. https://doi.org/10.1259/dmfr.22.3.8299832 .
-
Theil, M. (2002). ‘The role of translations of verbal into numerical probability expressions in risk management: a meta-analysis’. Journal of Risk Research 5 (2), pp. 177–186. https://doi.org/10.1080/13669870110038179 .
-
Timmermans, D. R. and Mileman, P. A. (1993). ‘Lost for words: using verbal terms to express probabilities in oral radiology’. Dentomaxillofacial Radiology 22 (4), pp. 171–172. https://doi.org/10.1259/dmfr.22.4.8181641 .
-
Timmermans, D. (1994). ‘The roles of experience and domain of expertise in using numerical and verbal probability terms in medical decisions’. Medical Decision Making 14 (2), pp. 146–156. https://doi.org/10.1177/0272989x9401400207 .
-
Tversky, A. and Kahneman, D. (1981). ‘The framing of decisions and the psychology of choice’. Science 211 (4481), pp. 453–458. https://doi.org/10.1126/science.7455683 . PMID: 7455683 .
-
Twitter Inc. (2018). Twitter webpage . URL: https://twitter.com/ .
-
Van Dale Uitgevers (2018). Van Dale webpage . URL: https://www.vandale.nl/ .
-
Venhuizen, G. J., Hut, R., Albers, C., Stoof, C. R. and Smeets, I. (2019). ‘Flooded by jargon: how the interpretation of water-related terms differs between hydrology experts and the general audience’. Hydrology and Earth System Sciences 23 (1), pp. 393–403. https://doi.org/10.5194/hess-23-393-2019 .
-
Visschers, V. H. M., Meertens, R. M., Passchier, W. W. F. and de Vries, N. N. K. (2009). ‘Probability information in risk communication: a review of the research literature’. Risk Analysis 29 (2), pp. 267–287. https://doi.org/10.1111/j.1539-6924.2008.01137.x .
-
Wallsten, T. S., Fillenbaum, S. and Cox, J. A. (1986). ‘Base rate effects on the interpretations of probability and frequency expressions’. Journal of Memory and Language 25 (5), pp. 571–587. https://doi.org/10.1016/0749-596x(86)90012-4 .
-
Weber, E. U. and Hilton, D. J. (1990). ‘Contextual effects in the interpretations of probability words: perceived base rate and severity of events’. Journal of Experimental Psychology: Human Perception and Performance 16 (4), pp. 781–789. https://doi.org/10.1037/0096-1523.16.4.781 .
-
Wintle, B. C., Fraser, H., Wills, B. C., Nicholson, A. E. and Fidler, F. (2019). ‘Verbal probabilities: very likely to be somewhat more confusing than numbers’. PLoS ONE 14 (4), e0213522. https://doi.org/10.1371/journal.pone.0213522 .
Authors
Sanne J.W. Willems is assistant professor in Applied Statistics at the Mathematical Institute at Leiden University, the Netherlands, and has a strong interest in statistics communication. Her PhD research focused on topics in survival analysis, nonlinear models, and statistics communication and she continues to work on these topics. Twitter: @SanneJWWillems. E-mail: s.j.w.willems@math.leidenuniv.nl .
Casper J. Albers is professor of Applied Statistics and Data Visualisation at the University of Groningen, the Netherlands. His research focuses on the development of statistical models for applications in the social sciences, clinical and environmental psychology in particular. Furthermore, he is interested in statistical literacy and statistical communication and an active advocate of open science practices. Twitter: @CaAl. E-mail: c.j.albers@rug.nl .
Ionica Smeets is professor of science communication at Leiden University, the Netherlands. Her main research interest is bridging the gap between experts and the general public. She enjoys working in interdisciplinary projects that focus on effective science communication about a specific topic, ranging from statistics to biodiversity and from hydrology to health research. Twitter: @ionicasmeets. E-mail: i.smeets@biology.leidenuniv.nl .