
1 Introduction
One of the essential aspects of citizen science projects is the democratization of actions involved and even decision making [Bela et al., 2016 ]. There is great diversity in the approaches on which non-professional individuals can participate in citizen science projects and activities [Wiggins and Crowston, 2011 ]. We can classify the degree to which non-professionals become involved in citizen science projects as mere sample collectors (contributory projects), as having the freedom to modify the work done by professional scientists (collaborative), and as co-creators alongside professionals [Bonney et al., 2009 ; Wilderman et al., 2007 ]. These modes of participation are not rigid: over time, non-professional develop abilities that allow them to contribute to the project in new ways and participate in making decisions over the project’s lifetime.
Co-created citizen science projects are those on which a substantial amount of the project’s decisions are taken by the community [Bonney et al., 2009 ]. These are also known as community-based projects, or ‘science by the people’ [Mansell, 2013 ]. In these types of projects, the community defines the problem, designs the study, collects the samples, analyzes the samples, and interprets it [Wilderman et al., 2007 ]. Both professional as non-professional scientists participate in decision-making activities and perform activities pertaining to the development of the project on the field, such as data collection and analysis.
The main advantages of co-created projects are a higher degree of appropriation done by the community towards project planning and the execution of its activities, as well as a more significant commitment and a certain degree of agency and independence from the guidance of professional scientists. Citizen science democratizes knowledge through a more horizontal mode of governance: the challenges and solutions proposed by the projects are brought closer to the problems suffered by the community, and they, in turn legitimize their participation through the application of acquired knowledge [Powell, 2016 ].
With this in mind, one of the most important challenges of community-based citizen science projects is to ensure that members of a community develop skills around scientific thinking [Brossard, Lewenstein and Bonney, 2005 ; Cronje et al., 2011 ]. Supporting the development of these skills is an essential factor in ensuring citizen science projects’ success, especially when interacting with dabblers — newcomers to scientific activities or sporadic participants of citizen science projects [Evans et al., 2005 ]. Dabblers are likely to drop out when they lack intrinsic motivators such as interest and curiosity, a perceived capacity to complete tasks, and an evaluation of the benefits and costs of contributing [Eveleigh et al., 2014 ].
For this reason, dabblers will benefit from understanding the value of their involvement through an exploration of the scientific questions in a specific project, e.g., how collecting data about a particular variable will allow them to answer a research question. Sharing back the information collected through a citizen science project with the community might not be enough to communicate citizen science projects’ goals or the thinking behind the proposed data collection activities. For this reason, citizen science proposes that all participants must understand and take part in defining the possible hypotheses to be addressed [Bonney et al., 2009 ], serving as a motivator collecting data to falsify them.
We argue that dabblers who engage in citizen science are ultimately volunteers and are thus motivated to participate for a more extended period if their participation proves to create value for themselves and their community [Vecina Jiménez, Chacón Fuertes and Abad, 2009 ]. In this sense, participants will be motivated by becoming science-literate and perceiving themselves as supporters of social justice values within their communities [Curtis, 2018 ; Geoghegan et al., 2016 ]. Participatory citizen science faces the challenge of ensuring that dabblers, or volunteers with little to no formation in scientific thinking, can internalize the understanding of science [Bonney et al., 2009 ; Cronje et al., 2011 ; Lee and Roth, 2003 ]. By observing and experiencing the usefulness of developing a falsifiable hypothesis and by verifying it through data collection and analysis, they will have a clearer view of the reasoning and motivations for scientific activities, as well as the social value of their involvement. This process will ensure a higher degree of commitment towards the project [Shirk et al., 2012 ].
This approach’s main goal is to introduce dabblers to the concepts of hypothesis and falsifiability PACMAP (Participatory Approach for Community Mapping), a card game designed to collect and visualize the perception of participants in communities. This game aims to help dabblers develop a falsifiable hypothesis as a starting point for a citizen science project by collecting and visualizing the perceptions of their community. This article will describe how PACMAP was used in five communities in San Salvador to establish and validate community-led hypotheses based on the community perception of social violence.
The article is divided into the following sections: (1) how Gamification can be utilized as a tool for developing scientific literacy through PACMAP, a card game for community mapping, (2) how this tool was used to introduce participants to the concepts of hypothesis and falsifiability through the exploration of social risk factors present in five communities located in San Salvador, (3) the results of this experience and insights from experience, and finally (4) recommendations on how PACMAP or card-based mapping games can be further developed to improve the engagement of dabblers in citizen science projects.
2 Using Games for citizen science
2.1 Incorporation of games in citizen science
Gamification is a design tool to improve public engagement by introducing game elements in non-game practices or spaces [Deterding et al., 2011 ]. Thus, it generates a fun environment that promotes several aspects, such as commitment, continuity, or recidivism [Seaborn and Fels, 2015 ]. One of the most important objectives of Gamification is to motivate players to complete a set of tasks by offering rewards such as points, badges, levels, progress bars or even, virtual money. Sometimes the reward is simply to have a funny moment. Another fundamental method to increase motivation is to add some kind of competition between players, either by creating position tables or comparisons with friends in social networks [Kim, 2015 ; Chou, 2015 ; Werbach and Hunter, 2012 ]. Gamification has been applied in several contexts such as education [Domínguez et al., 2013 ; Dreimane, 2019 ], production [Korn, Funk and Schmidt, 2015 ; Naik and Jenkins, 2019 ; Pedreira et al., 2015 ], sales [Frith, 2013 ] or science [Khatib et al., 2011 ; Tinati et al., 2017 ].
There are different approaches associated with incorporating Gamification in citizen science projects. Many of them are related to a specific aspect of the project, for example, rewarding when data collection is performed [Celasco et al., 2016 ; Kanner et al., 2018 ]. One of the first experiences in the use of Gamification in citizen science projects was,” I want to be a captain! I want to be a captain!” [Eveleigh et al., 2013 ] which proposes a narrative in a transcription activity. Also, Eye Wire [Tinati et al., 2017 ] and FoldIt [Khatib et al., 2011 ] are projects through Gamification the player color images or complete a puzzle in 3D models. All cases include gamification strategies to engage players.
This approach’s main goal is to introduce dabblers to the concepts of hypothesis and falsifiability through a mapping card game. The game is designed to achieve the following specific objectives:
- To improve participation in data collection and mapping.
- To define a hypothesis based on community perception.
- To design monitoring initiatives related to social violence.
- To validate the hypothesis.
Previous work in the literature studied the use of Gamification to develop scientific skills. From a narrow point of view, Gamification is considered as the use of video games. Morris et al. [ 2013 ] introduced an approach to using video games by describing three main elements where video games support the development of scientific thinking. These are: a context to promote inquiry-based learning, scientific skills are embedded in the game rules, or other than promotes skills and values in a non-explicit manner. Scientific video games help develop a need for evidence in the discourse, a model of reasoning, or an understanding of evidence. Although our approach is not a video game, it works in need to understand the evidence to be used in scientific discourse.
More specific scientific card games appear in the literature. However, at the moment of writing this article, the authors were not able to find particular card games to enhance hypothesis definition and validation. Less related, Voyage Card games and Top Careers in Science [Smith and Munro, 2009 ] are card games with a scientific background but without being specialized in developing a hypothesis.
3 PACMAP card game
PACMAP (Participatory Approach for Community Mapping) is a card game intended to collect and visualize participants’ perception in communities through the creation of a digital map that displays social or environmental hazards. This game aims to involve participants with little scientific literacy or experience in citizen science on the definition of a hypothesis based on their environmental perceptions. The game prompts questions to create a map which are discussed at the end of the activity. This collective assessment will guide them to understand these initial assumptions and understand how subsequent data collection and data analysis will help them validate them.
Digital participatory mapping is deemed a powerful tool for representing the knowledge and needs inside of communities [Gordon, Elwood and Mitchell, 2016 ; Lundine, Kovačič and Poggiali, 2012 ] since data visualizations are effective mediums to aid the development of competencies for interpreting data [Golumbic, Fishbain and Baram-Tsabari, 2020 ]. The use of digital tools for mapping will require training for the development of these digital skills and access to hardware. PACMAP is intended to use digital tools in a non-intrusive manner through a card game that is easy to understand and can be played without previous knowledge other than the current situation inside and in the vicinity of the community.
By establishing a fast-paced ludic environment, the activity posed questions about the community’s qualitative aspects related to four social variables: personal activities and routine, leisure time inside the community, road safety around the community, and vulnerability to social violence. A digital map is generated at the end of the workshop, with a visual representation of the participants’ responses. As the results are discussed, participants are encouraged to develop an initial hypothesis regarding the social hazards being studied in the session.
3.1 Game mechanics
The game utilizes the following resources:
Cards: PACMAP is played with two decks of cards, each of which are identified by a unique number and either a scenario or a location:
- The scenario deck contains an incomplete sentence related to a potential social distress situation; the phrase is meant to be completed with a location. For example: When I walk through ___, I feel confident that I will not be robbed . These scenarios are designed to reflect the social categories under assessment. It is important to note that scenarios were worded as true by default so that participants would vote to refute the statement
- The location deck contains predetermined locations inside and outside of the neighborhood. These represent a recognizable address or landmark, such as an intersection, a business, or a public space. Figure 1 shows examples of scenario and location cards.
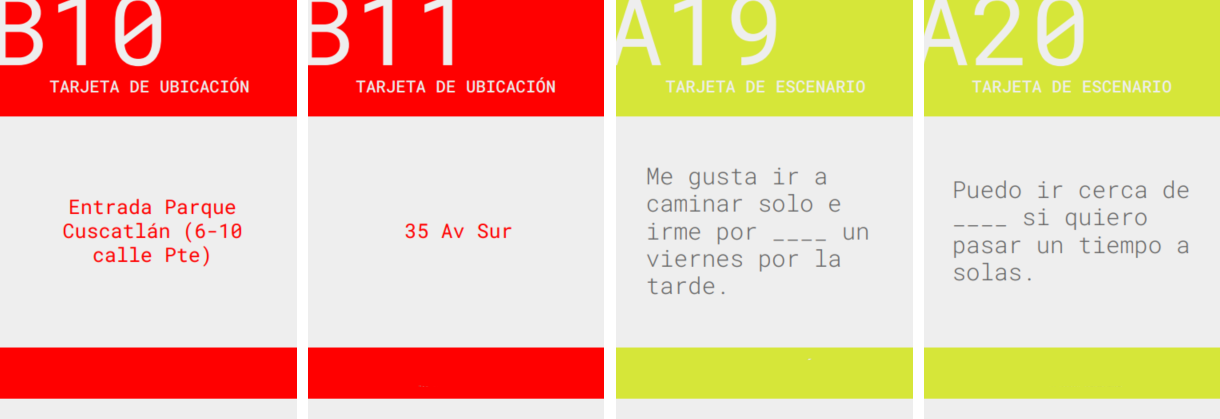
Voting cards: although these are not necessary to play the game, each participant was given a red card or sign, which they can use to vote “no” for each round according to the scenario mentioned by the moderator.
Computer and projector: after the participants finish the game, a script written in R is used to process the results registered by the facilitators. The data is used to generate a map projected on the wall at the end of the game.
Game mechanics: before playing the game, a map of the community with the pre-selected points (listed as depicted in the cards) is projected to the participants. All the points are reviewed to ensure that all participants understand where these points are located.
At the start of the game, one of the participants is chosen to draw out the cards and announce them to the group. This moderator can be switched if necessary at any point during the game. The moderator will draw two cards from the two stacks to form different sentences. For example: “While walking outside of Parque Cuscatlán (Cuscatlán Park), I do not feel afraid of being robbed.” Prompted by the moderator reading the cards, participants will vote whether they agree or not with the moderator by lifting the flag or card in a show of disagreement of the statement.
As participants respond, a facilitator updates a data sheet that lists the following: the identifier for the scenario and location cards in use, and the number of negative votes (e.g., scenario #3; location #29; votes: 12). If stacks run out of cards, the moderator can shuffle the decks and start a new round of questions, prompting different combinations.
Depending on the number of participants, more rounds can be played to record a fair amount of responses for each data point and location. However, it is recommended to stop at each round with a change of activity in order to avoid monotony.
3.2 Dynamics
At the end of the activity, the response sheet is fed to a script, which will, in turn, generate a map showing the score for each of the data points. The map is projected and discussed with the participants to validate their perceptions and find possible explanations for the higher perceived risk in some areas, based on the group’s personal experiences.
As a result of this exercise, one or more hypotheses will be defined. These can be used in the future to determine data collection, places of intervention, and the tools for monitoring.
4 Using PACMAP in urban San Salvador
4.1 Project background
The study was conducted as part of a project called Labs de Resiliencia (Resilience Labs), which consisted of a project focused on developing community resilience. This project was part of a broader international urban intervention oriented toward the urban development of one of the most centric areas in San Salvador.
This component of the project focused on developing skills for the social and environmental resilience of five urban communities. It was composed of activities for people of different age groups within the community. Activities focused on participatory mapping and diagnostics, teaching skills for electronics and programming, the development of electronic prototypes, and its use to monitor social variables in the community. The project aimed to improve the conditions of areas surrounding these communities to enable access, improve safety, and encourage community interaction from different socioeconomic groups concerning the Parque Cuscatlán. This historic landmark was being renovated.
The workshops served to collect spatial information related to hazards present in the area. Workshops’ activities implied the evaluation of possible commute routes from the park to the communities and the schedules of different age groups in the community: at what time they commute to work, how they commute, where do youth meet, what do they do for leisure, etc.
4.2 Communities
The Labs de Resiliencia project, under which this mapping component was integrated, was focused in five communities located around the Cuscatlán Park: Santa Fe y La Paz, 1 Tutunichapa 1, Atonal y Asunción, working-class urban settlements located close to the city downtown. Some of these communities originated as informal settlements around the 1960s when low-income populations moved to government-owned areas dangerously close to river banks.
As the city developed over the years, these settlements have already become part of the landscape. These families are entitled to the land and have obtained deeds to the lands where they reside. Despite this, they continue to be vulnerable due to the location and low-quality construction of their homes. They also suffer from other social problems due to their proximity to busy roads, which were not developed with road safety elements designed with these communities in mind, the lack of public spaces, and the area’s high crime rates.
4.3 Workshop design
A series of workshops for social mapping using PACMAP took place in each of the five communities during January of 2018. The game was used to identify safe and unsafe areas along the route between the communities and the Cuscatlán Park. The activity also sought to involve participants of all ages and groups, which usually would not interact with each other.
4.4 Data points and cards
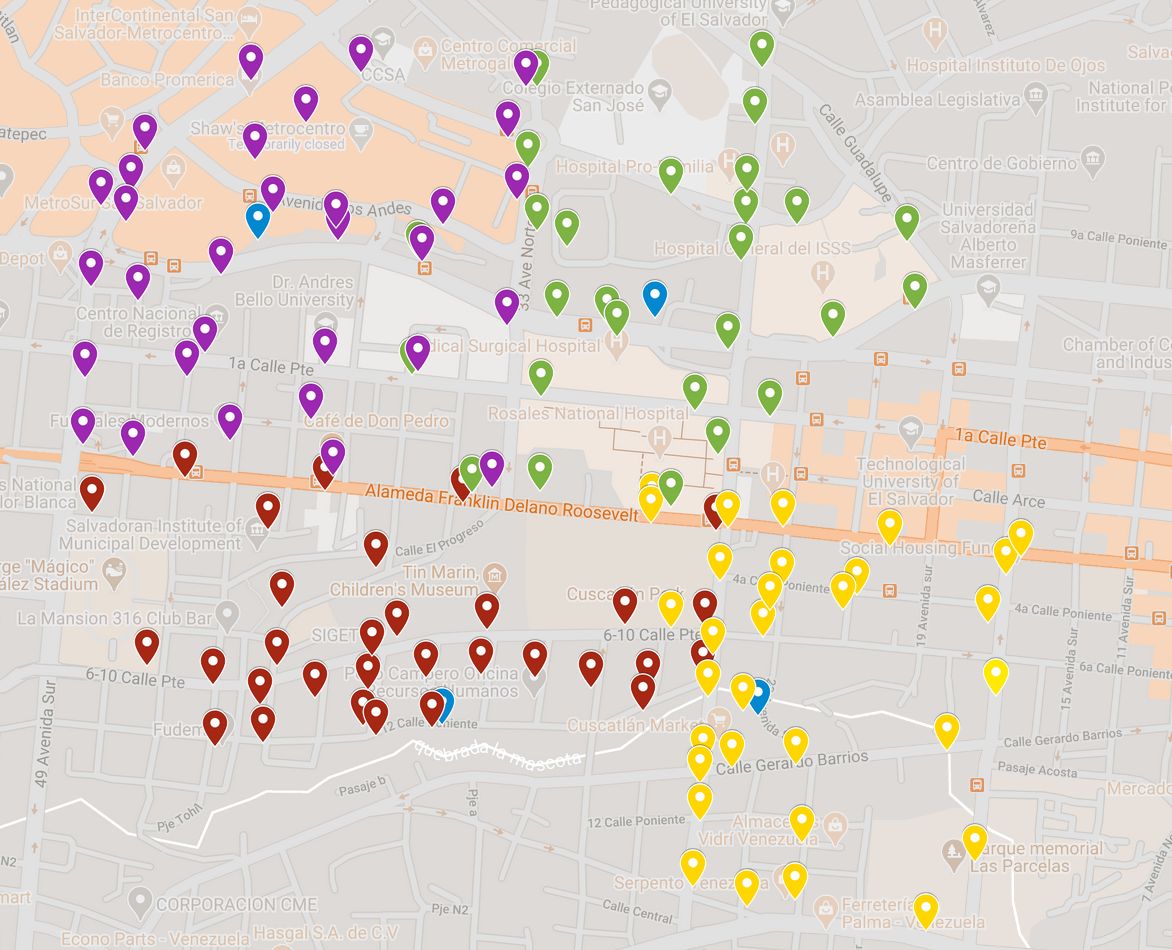
As a preparation for the game, a list of location points (25–35) was selected for each community. The locations were easily identified by participants within an area between the park and the communities.
The lists of locations (and thus the location cards) for each community were different, but some of the points were shared between the lists if the areas between the park and the communities overlapped (Figure 2 ). This ensured that each map generated would depict different areas surrounding the park and could be combined to have a broader view of the area’s perceptions.
Likewise, a set of scenarios was chosen based on the four areas of social discomfort: personal leisure time, community interaction, social violence, and road safety. These were previously identified through discussions with community leaders and other project stakeholders.
4.5 Participants
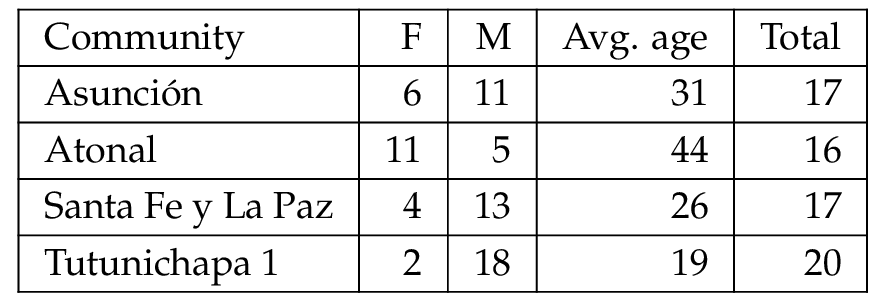
The five participant communities contain very similar demographics in terms of family composition and socioeconomic status. Despite these similarities, however, current social dynamics and community safety are made up of relatively different groups. The of the participant groups were comprised of: Santa Fe y La Paz 2 (n=17), led by mostly male youth; Atonal (n=16) composed mainly by older women and single mothers; Tutunichapa 1 (n=20) of primarily young males, and Asunción (n=17) with the participation of families and mid-age adults. The average age for all participants of the four workshops was 29.6 years old. Table 1 shows the demographic characteristics of the participants. The first column includes the communities’ names. The details of the second and third columns detail the number of female and male participants. The fourth column details the average of ages and the last one, the total amount of participants.
4.6 Procedure
Each PACMAP workshop consisted of at least two rounds of gameplay in order to collect enough data to render the maps, but making sure not to drag their participation for too long. The game began with a short presentation of the game mechanics and the expected result. The following recommendations were given to participants: to answer as fast as possible to focus on their perception and avoid being influenced by other participants; to discuss the answers as little as possible during the game to reduce interruptions of the game for the rest.
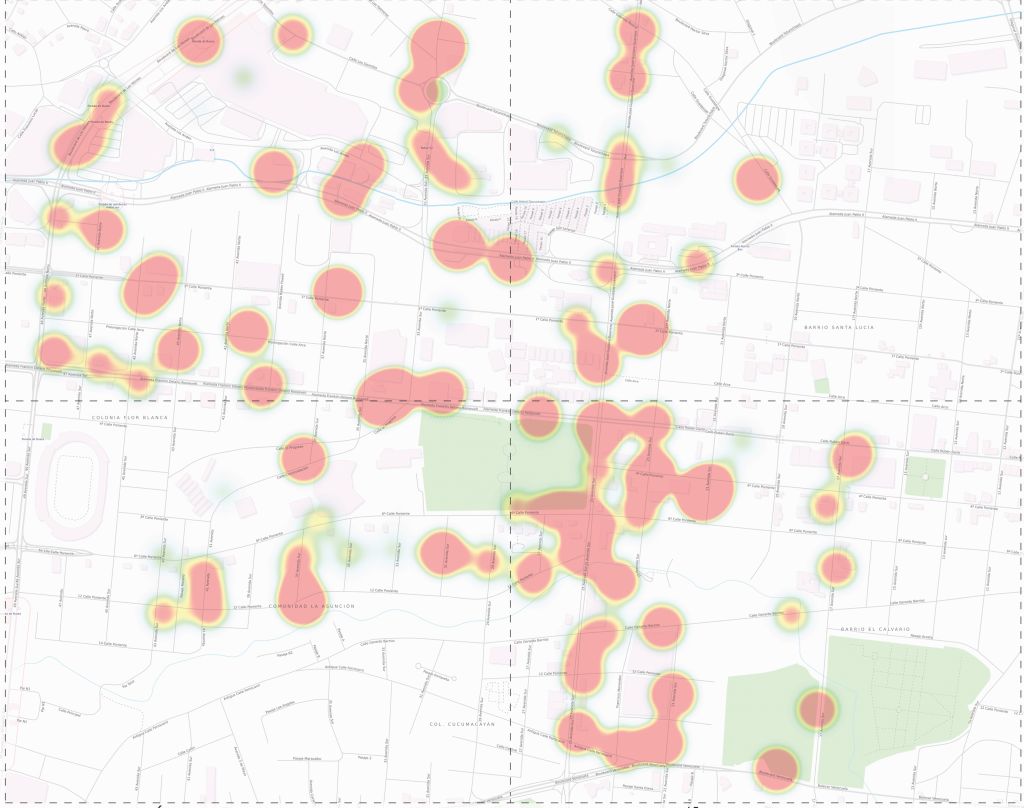
One of the facilitators took note of the selected cards and the number of responses per set of cards on a paper sheet. During the break at the end of each round, these observations were fed into a digital spreadsheet. At the end of the game, a complete registry of the observations was processed by the script, which calculated scores for every map point. Scores were used to elaborate a hot spot map and projected back to the participants at the end of the activity. In some sense, the hypothesis was described in terms of a map: The hot spots in the map are unsafe zones.
4.7 Creation of the hypothesis
The maps generated at the end of the game were used for participants to visualize and analyze the collected data. Figure 3 details an example of a generated map with PACMAP. The following questions were discussed with the participants:
- What are the riskiest areas according to the map?
- Are there other dangerous areas not considered on the map?
- What do you think are the reasons for these scores?
- Do you go through these areas daily? Why or why not?
- Is it possible to verify the assumptions shown on this map? How?
- Who are the most vulnerable groups? Is it women, men, people with disabilities, the elderly, or children?
5 Results and discussion
5.1 Mechanics
The goal of PACMAP is that participants collaborate in developing a shared understanding of a falsifiable hypothesis based on their perceptions. As a result, participants will develop a motivation based on their knowledge of citizen science objectives. Nicholson [ 2015 ] describes this gamification approach as “meaningful gamification,” in which games are devoid of external rewards and focus instead on intrinsic motivations as a source of meaningfulness. His framework of meaningful Gamification is based on the following principles: Play (a fun experience under an agreed set of rules), exposition (a connection to a real-world setting), choice (a sense of agency), information (helping participants learn about the world), engagement (enabling participation and collaboration), reflection (using the game to explore past experiences).
An introduction section was essential to establish a common understanding of the rules under which participants can collaborate. Before starting the game, the facilitators defined a short quick discussion of the variables to be measured and a brief review of the map locations as a sort of a virtual tour of the community. This served as an icebreaker for the activity and as a preparation for a collaborative group dynamic, as participants collaborated with their neighbors by describing the locations to those who did not identify them at first.
5.2 Dynamics
The game was utilized in four opportunities with community members from different ages and levels of education, with good results. All participants seemed to understand the game, and it was easy to explain. Participants of all ages were able to understand the dynamics of the game quickly. As each sentence from the cards is read aloud, this allowed children, the elderly, and other illiterate individuals to play the game without any problems.
Scenarios were generated randomly, which allowed choosing unexpected responses. In some cases, the irony of the statement served to amuse participants (for example, when the busiest road was stated as a perfect place to go for a stroll). The game helped to reflect on their personal and collective experiences.
The quick pacing of the game allowed for very few discussions or disagreements during the activity. Participants emitted their opinion without restrictions and developed a sense of equality, addressing possible hidden social dynamics inside the community that could reduce the freedom of some participants to speak their minds [Weyer, Bezerra and De Vos, 2019 ]. As the game progressed, participants felt more comfortable voicing their opinions, giving way to short but insightful opinions. In the end, the common understanding of the problem in their communities helped to establish a sense of involvement among all the participants.
5.3 Visual communication and analysis
The data presentation format was devised with an emphasis on communicating results to the extent of accuracy. As the number of points in the map increased, certain liberties were taken to tweak the scores’ scale to translate relative weights so that the points were quickly identified and that differences were visible.
The discussion was facilitated with falsifiability in mind: participants were allowed to challenge the results under the possibility that their initial perceptions were wrong. The discussion of the maps served to validate them: participants engaged in discussing the possible causes for the scores in some areas.
5.4 Outcomes
The four workshops managed to draw a total of 231 scenario-location combinations for 3803 observations. The average score of 66.33% ( = 38.88%), with a higher score signifying a more negative score. Individual scores were as follows: Asuncion (51.10%), Atonal (67.23%), Santa Fe and La Paz (76.23%), Tutunichapa (71.48%). Communities with the higher scores were the ones with younger participants, a perception that coincides with the higher risk suffered by youth in El Salvador, with a mortality rate of 207.5 per 100,000 inhabitants in 2015, a rate much higher than the world average of 149 per 100,000 inhabitants [Martínez-Reyes and Navarro Pérez, 2020 ].
Results were given immediately at the end of the game to participants for discussion to validate their understanding of the obtained hypothesis. All participants showed their agreement with the results of the game. Discussions were lengthy and insightful. They connected the map results with their personal experiences, descriptions about what they see during their commute, or issues currently happening in their communities.
Participants of all the workshops validated the results, which served for future activities; for example, when planning monitoring activities related to traffic, participants pointed towards measuring the number of cars per hour at the locations found in the map.
6 Conclusions
One of the premises of co-created science projects is the ability to share data and the results with all members of a project, but ensuring that participants without a scientific background can understand or analyze a set of data with little context is a challenge. However, if a person from a community participates in defining the variables to be measured, collect them. When the results are given back to analyze and understand them, they can interiorize or utilize the information. For this process to occur, there must be a clear understanding of the relationship between the research questions, which represent the interests of both professional scientists and citizens, and data collection.
PACMAP is a game that takes advantage of the benefits given by online games, but the use of a card deck gives it many advantages. For example, using a physical game allows it to be more approachable for participants without digital literacy, such as low-income populations, children, or older people. It also allows all participants to focus on the subject at hand without derailing the conversation by using technology.
This experience opens the opportunity for Gamification, especially on the intersection of physical and digital games, to support dabblers in their understanding of scientific concepts and interact with other participants by using standard rules and equal empowerment. The game helped individuals reflect on their daily lives and their community’s situation by establishing a game dynamic that connected an engaging activity with their personal lives. The use of technology was minimal and served to accelerate the process. The results were presented to open the opportunity to generate discussion over results obtained in real-time and with input from every participant in the room.
The game was effective in communicating the idea of a hypothesis to participants despite their lack of knowledge of the scientific method. “Science-education strategies should focus on the more general problem of increasing the science literacy of the general public rather than the recruitment of future scientists.” [Zen, 1990 ]. PACMAP allowed participants to learn about science by not focusing on producing scientifically verifiable data but engaging them with citizen science in an understandable and approachable manner.
References
-
Bela, G., Peltola, T., Young, J. C., Balázs, B., Arpin, I., Pataki, G., Hauck, J., Kelemen, E., Kopperoinen, L., Van Herzele, A., Keune, H., Hecker, S., Suškevičs, M., Roy, H. E., Itkonen, P., Külvik, M., László, M., Basnou, C., Pino, J. and Bonn, A. (2016). ‘Learning and the transformative potential of citizen science’. Conservation Biology 30 (5), pp. 990–999. https://doi.org/10.1111/cobi.12762 .
-
Bonney, R., Ballard, H., Jordan, R., McCallie, E., Phillips, T., Shirk, J. and Wilderman, C. C. (2009). Public Participation in Scientific Research: Defining the Field and Assessing Its Potential for Informal Science Education . A CAISE Inquiry Group Report. Washington, D.C., U.S.A.: Center for Advancement of Informal Science Education (CAISE). URL: http://www.informalscience.org/public-participation-scientific-research-defining-field-and-assessing-its-potential-informal-science .
-
Bonney, R., Cooper, C. B., Dickinson, J., Kelling, S., Phillips, T., Rosenberg, K. V. and Shirk, J. (2009). ‘Citizen Science: a Developing Tool for Expanding Science Knowledge and Scientific Literacy’. BioScience 59 (11), pp. 977–984. https://doi.org/10.1525/bio.2009.59.11.9 .
-
Brossard, D., Lewenstein, B. and Bonney, R. (2005). ‘Scientific knowledge and attitude change: The impact of a citizen science project’. International Journal of Science Education 27 (9), pp. 1099–1121. https://doi.org/10.1080/09500690500069483 .
-
Celasco, M., Yanez, J. I., Gamen, R., Fernandez, A., Diaz, A. and Torres, D. (2016). ‘Galaxy conqueror: astronomy, citizen science and gamification’. In: Proceedings — 2016 XI Latin American Conference on Learning Objects and Technology (LACLO) . IEEE. https://doi.org/10.1109/laclo.2016.7751798 .
-
Chou, Y.-K. (2015). Actionable gamification: beyond points, badges and leaderboards. Octalysis Media.
-
Cronje, R., Rohlinger, S., Crall, A. and Newman, G. (2011). ‘Does Participation in Citizen Science Improve Scientific Literacy? A Study to Compare Assessment Methods’. Applied Environmental Education & Communication 10 (3), pp. 135–145. https://doi.org/10.1080/1533015X.2011.603611 .
-
Curtis, V. (2018). ‘Motivation for participation: from general volunteerism to online citizen science’. In: Online citizen science and the widening of academia. Cham, Switzerland: Springer International Publishing, pp. 69–92. https://doi.org/10.1007/978-3-319-77664-4_4 .
-
Deterding, S., Khaled, R., Nacke, L. and Dixon, D. (2011). ‘Gamification: toward a definition’. In: CHI 2011 Gamification Workshop Proceedings , pp. 12–15. URL: http://gamification-research.org/wp-content/uploads/2011/04/02-Deterding-Khaled-Nacke-Dixon.pdf .
-
Domínguez, A., Saenz-de-Navarrete, J., de-Marcos, L., Fernández-Sanz, L., Pagés, C. and Martínez-Herráiz, J.-J. (2013). ‘Gamifying learning experiences: practical implications and outcomes’. Computers & Education 63, pp. 380–392. https://doi.org/10.1016/j.compedu.2012.12.020 .
-
Dreimane, S. (2019). ‘Gamification for education: review of current publications’. In: Didactics of smart pedagogy. Cham, Switzerland: Springer International Publishing, pp. 453–464. https://doi.org/10.1007/978-3-030-01551-0_23 .
-
Evans, C., Abrams, E., Reitsma, R., Roux, K., Salmonsen, L. and Marra, P. P. (2005). ‘The Neighborhood Nestwatch Program: Participant Outcomes of a Citizen-Science Ecological Research Project’. Conservation Biology 19 (3), pp. 589–594. https://doi.org/10.1111/j.1523-1739.2005.00s01.x .
-
Eveleigh, A., Jennett, C., Blandford, A., Brohan, P. and Cox, A. L. (2014). ‘Designing for dabblers and deterring drop-outs in citizen science’. In: Proceedings of the IGCHI Conference on Human Factors in Computing Systems (CHI ’14) . New York, NY, U.S.A.: ACM Press, pp. 2985–2994. https://doi.org/10.1145/2556288.2557262 .
-
Eveleigh, A., Jennett, C., Lynn, S. and Cox, A. L. (2013). ‘"I want to be a captain! I want to be a captain!": gamification in the old weather citizen science project’. In: Proceedings of the First International Conference on Gameful Design (Gamification ’13) . New York, NY, U.S.A.: ACM Press, pp. 79–82. https://doi.org/10.1145/2583008.2583019 .
-
Frith, J. (2013). ‘Turning life into a game: foursquare, gamification and personal mobility’. Mobile Media & Communication 1 (2), pp. 248–262. https://doi.org/10.1177/2050157912474811 .
-
Geoghegan, H., Dyke, A., Pateman, R., West, S. and Everett, G. (2016). Understanding motivations for citizen science. Final report on behalf of UKEOF, University of Reading, Stockholm Environment Institute (University of York) and University of the West of England. Swindon, U.K.: UKEOF. URL: http://www.ukeof.org.uk/resources/citizen-science-resources/MotivationsforCSREPORTFINALMay2016.pdf .
-
Golumbic, Y. N., Fishbain, B. and Baram-Tsabari, A. (2020). ‘Science literacy in action: understanding scientific data presented in a citizen science platform by non-expert adults’. International Journal of Science Education, Part B , pp. 1–16. https://doi.org/10.1080/21548455.2020.1769877 .
-
Gordon, E., Elwood, S. and Mitchell, K. (2016). ‘Critical spatial learning: participatory mapping, spatial histories and youth civic engagement’. Children’s Geographies 14 (5), pp. 558–572. https://doi.org/10.1080/14733285.2015.1136736 .
-
Kanner, A. I., Torres, D., Lombardelli, J. and Peri, C. (2018). ‘Analyzing the use of gamification in a tutorial for a citizen science project’. In: 2018 XIII Latin American Conference on Learning Technologies (LACLO) . IEEE, pp. 208–215. https://doi.org/10.1109/laclo.2018.00048 .
-
Khatib, F., Cooper, S., Tyka, M. D., Xu, K., Makedon, I., Popoviæ, Z., Baker, D. and Foldit Players (2011). ‘Algorithm discovery by protein folding game players’. Proceedings of the National Academy of Sciences 108 (47), pp. 18949–18953. https://doi.org/10.1073/pnas.1115898108 .
-
Kim, B. (2015). ‘Understanding gamification’. Library Technology Reports 51 (2), p. 1. https://doi.org/10.5860/ltr.51n2 .
-
Korn, O., Funk, M. and Schmidt, A. (2015). ‘Design approaches for the gamification of production environments’. In: Proceedings of the 8th ACM International Conference on Pervasive Technologies Related to Assistive Environments . ACM. https://doi.org/10.1145/2769493.2769549 .
-
Lee, S. and Roth, W.-M. (2003). ‘Science and the “good citizen”: community-based scientific literacy’. Science, Technology, & Human Values 28 (3), pp. 403–424. https://doi.org/10.1177/0162243903028003003 .
-
Lundine, J., Kovačič, P. and Poggiali, L. (2012). ‘Youth and digital mapping in urban informal settlements: lessons learned from participatory mapping processes in mathare in Nairobi, Kenya’. Children, Youth and Environments 22 (2), pp. 214–233. https://doi.org/10.7721/chilyoutenvi.22.2.0214 .
-
Mansell, R. (2013). ‘Employing digital crowdsourced information resources: managing the emerging information commons’. International Journal of the Commons 7 (2), p. 255. https://doi.org/10.18352/ijc.395 .
-
Martínez-Reyes, K. A. and Navarro Pérez, J. J. (2020). ‘Obstáculos para el logro de los ODS en El Salvador. Políticas de juventud, jóvenes pandilleros y las ONG: un análisis complejo’. Revista iberoamericana de estudios de desarrollo = Iberoamerican journal of development studies 9 (1), pp. 28–51. https://doi.org/10.26754/ojs_ried/ijds.444 .
-
Morris, B. J., Croker, S., Zimmerman, C., Gill, D. and Romig, C. (2013). ‘Gaming science: the “gamification” of scientific thinking’. Frontiers in Psychology 4, p. 607. https://doi.org/10.3389/fpsyg.2013.00607 .
-
Naik, N. and Jenkins, P. (2019). ‘Relax, it’s a game: utilising gamification in learning agile scrum software development’. In: 2019 IEEE Conference on Games (CoG) . IEEE, pp. 1–4. https://doi.org/10.1109/cig.2019.8848104 .
-
Nicholson, S. (2015). ‘A RECIPE for meaningful gamification’. In: Gamification in education and business. Cham, Switzerland: Springer International Publishing, pp. 1–20. https://doi.org/10.1007/978-3-319-10208-5_1 .
-
Pedreira, O., García, F., Brisaboa, N. and Piattini, M. (2015). ‘Gamification in software engineering — a systematic mapping’. Information and Software Technology 57, pp. 157–168. https://doi.org/10.1016/j.infsof.2014.08.007 .
-
Powell, A. (2016). ‘Hacking in the public interest: Authority, legitimacy, means, and ends’. New Media & Society 18 (4), pp. 600–616. https://doi.org/10.1177/1461444816629470 .
-
Seaborn, K. and Fels, D. I. (2015). ‘Gamification in theory and action: a survey’. International Journal of Human-Computer Studies 74, pp. 14–31. https://doi.org/10.1016/j.ijhcs.2014.09.006 .
-
Shirk, J. L., Ballard, H. L., Wilderman, C. C., Phillips, T., Wiggins, A., Jordan, R., McCallie, E., Minarchek, M., Lewenstein, B. V., Krasny, M. E. and Bonney, R. (2012). ‘Public Participation in Scientific Research: a Framework for Deliberate Design’. Ecology and Society 17 (2), p. 29. https://doi.org/10.5751/ES-04705-170229 .
-
Smith, D. R. and Munro, E. (2009). ‘Educational card games’. Physics Education 44 (5), pp. 479–483. https://doi.org/10.1088/0031-9120/44/5/004 .
-
Tinati, R., Luczak-Roesch, M., Simperl, E. and Hall, W. (2017). ‘An investigation of player motivations in Eyewire, a gamified citizen science project’. Computers in Human Behavior 73, pp. 527–540. https://doi.org/10.1016/j.chb.2016.12.074 .
-
Vecina Jiménez, M. L., Chacón Fuertes, F. and Abad, M. J. S. (2009). ‘Satisfacción en el voluntariado: estructura interna y relación con la permanencia en las organizaciones’. Psicothema 21 (1), pp. 112–117.
-
Werbach, K. and Hunter, D. (2012). For the win. How game thinking can revolutionize your business. Wharton Digital Press.
-
Weyer, D., Bezerra, J. C. and De Vos, A. (2019). ‘Participatory mapping in a developing country context: lessons from South Africa’. Land 8 (9), p. 134. https://doi.org/10.3390/land8090134 .
-
Wiggins, A. and Crowston, K. (2011). ‘From Conservation to Crowdsourcing: a Typology of Citizen Science’. In: Proceedings of the 44 th Hawaii International Conference on System Sciences (HICSS-44) . Kauai, HI, U.S.A. Pp. 1–10. https://doi.org/10.1109/HICSS.2011.207 .
-
Wilderman, C. C., McEver, C., Bonney, R., Dickinson, J., Kelling, S. and Rosenberg, K. (2007). ‘Models of community science: design lessons from the field’. In: Citizen science toolkit conference (Cornell Laboratory of Ornithology, Ithaca, NY, U.S.A.). Ed. by C. McEver, R. Bonney, J. Dickinson, S. Kelling, K. Rosenberg and J. L. Shirk, pp. 1–3.
-
Zen, E.-A. (1990). ‘Science literacy and why it is important’. Journal of Geological Education 38 (5), pp. 463–464. https://doi.org/10.5408/0022-1368-38.5.463 .
Authors
Emilio Velis is an industrial engineer based in San Salvador. He is Executive Director of the Appropedia Foundation and Adjunct Lecturer at the Heller School of Sustainable International Development of Brandeis University. E-mail: contacto@emiliovelis.com .
Diego Torres graduated in 2009 with a diploma (Licenciatura) in Computer Science from Universidad Nacional de La Plata, in Argentina. In October 2014 he got a Ph.D. in Computer Science from the Universidad Nacional de La Plata (Argentina) and Ph.D. from the Université de Nantes (France) with the thesis “Co-evolution between Social and Semantic Web”. Social Semantic Web, Semantic Web, Linked Open Data, Recommender systems and Citizen Science are the main topics on his research activities. E-mail: diego.torres@lifia.info.unlp.edu.ar .
Gino Caballero is a civil engineer with a masters degree in Disaster Management from the National Institute for Policy Studies (GRIPS) in Japan. He is the Disaster Risk Reduction and Response coordinator for Habitat for Humanity El Salvador and is an independent consultant for DR3 related projects. E-mail: caballero.m.gino@gmail.com .
Endnotes
1 For purposes of this study, these two were considered as a unit due to being located close to each other despite being distinct communities.